
We might be approaching a key inflection point in the charts where funding currencies take a breather from its elongated movements just as the PBOC continues to make sure that the volatility and weakness around the Yuan slow down as global Central Banks commit to more easing, some quite aggressively as seen by the RBNZ.
The Daily Edge is authored by Ivan Delgado, Market Insights Commentator at Global Prime. The purpose of this content is to provide an assessment of the market conditions. The report takes an in-depth look of market dynamics, factoring in fundamentals, technicals, inter-market in order to determine daily biases and assist one’s decisions on a regular basis. Feel free to follow Ivan on Twitter & Youtube. You can also subscribe to the mailing list to receive Ivan’s Daily wrap.
Quick Take
The favorite play by the market has been to keep a sustained bid on funding-currencies (EUR, JPY, CHF) as derisking dynamics led to an unwind of carry trades. Capital that was borrowed in low yielding currencies and put to work in a high-return currency has scrambled to the exits as the problem becomes that on episodes of 'risk aversion' as seen in the US-China trade conflict morphing into a currency war, these positions tend to quickly go underwater as the market psyche resorts to old fashion safe havens. However, we might be approaching a key inflection point in the charts where funding currencies take a breather from its elongated movements just as the PBOC continues to make sure that the volatility and weakness around the Yuan slow down as global Central Banks commit to more easing, some quite aggressively as seen by the RBNZ. The Fed and ECB, amid this backdrop, are also readying more ammunition to come to the rescue to control volatility, even if might be harder to do so if the focus stays on currency wars. The key barometer to determine the market profile on a daily basis remains the Yuan valuation, and in line with the synopsis presented today, we continue to see a PBOC that has taken the foot off the gas pedal by relaxing the fixing rate, which came not as weak as expected. This appears to be helping risk trades early on Thursday.
The indices show the performance of a particular currency vs G8 FX. An educational article about how to build your own currency meter can be found in the Global Prime's Research section. Narratives In Financial Markets
* The Information is gathered after scanning top publications including the FT, WSJ, Reuters, Bloomberg, ForexLive, Institutional Bank Research reports.
The RBNZ shocks the market: The market was flummoxed to witness the New Zealand Central Bank cutting its rate by more-than-expected (50bp), essentially dismissing the spectacular labor data from earlier in the week to instead reach a unanimous rate cute decision on the basis that, as the statement notes, “the actions demonstrate our ongoing commitment to ensure inflation increases to the midpoint of the target range, and employment remains around its maximum sustainable level." In his press conference, RBNZ Governor Orr did not rule out the possibility of neither further action nor negative interest rates.
Other CBs deliver surprise cuts: The universal easing paths taken by Central Banks globally reveals a troubling backdrop. It wasn’t just the RBNZ cutting rates aggressively on Wednesday, but this decision was followed by a surprising 35bp depo rate cut by the RBI (Reserve Bank of India) to 5.4% versus expectations for a 25bp cut, which is the lowest since 2010. In another unexpected move, the BoT (Bank of Thailand) also cut its interest rate by 25bp to 1.5% after a 5-2 vote by the committee. What all these cuts portray is the perception that further pre-emptive measures must be taken to weather the economic headwinds (both globally and domestically) as the US-China trade war escalates, which incentivizes CBs to resort to lower rates not only to stimulate their economies and make money cheaper but also for a more competitive exchange rate (currency wars).
Odds of RBA rate cut edge up: The shocking 50bp cut by the RBNZ has spilled over into the Australian money market, with the odds of a Sept RBA rate cut rising sharply as indicated by the Australian 10-year yields, which has fallen below the cash rate of 1.00%. If we were to compare where cash rate futures sit today vs yesterday, the chances of another cut by the RBA have risen by over 20% to currently stand at nearly 70& from the roughly 50% chances pre-RBNZ. Traders will be able to get further insights from the RBA this Friday, as RBA governor Lowe delivers the central bank's semi-annual testimony to the House Economics Committee while at the same time, the latest Statement on Monetary Policy (SoMP) from the central bank will be released.
It keeps getting uglier in Germany: German industrial production fell sharply in June, coming at -1.5% MoM vs -0.5% expected, caused by broad-based weakness across all subcomponents (consumer, capital intermediate goods) with the exception of construction. There are mounting risks that the persistent weakness leads to broader economy fragility in the German economy over the coming months. Under such a vulnerable global backdrop with Central Banks bringing their A ‘dovish game’, this data will only solidify the idea that the ECB will need to act quite aggressive in Sept.
Fed to choose between cuts or vol: The dynamics we continue to see in the forex market mean that leveraged and carry trades face the prospects of being further unwound, which tends to lead to funding currencies the likes of the EUR, CHF, and JPY to see further demand. Moreover, as yield curves all over the world keep flattening sharply with further inversions around the corner, Central Bank must keep acting via further easing measures in order to stabilize market volatility. This makes the case for further rate cuts by the Fed during the Sept meeting a highly likely outcome reflected by the CME Fedwatch tool. For now, the risk pendulum remains the level of the RMB (Yuan).
China-US trade pretense still 'on': Even if the stalemate between the US and China looks worse than prior to the truce reached in the G20, the SCMP is out with an article suggesting that the Asian giant still keeps the door open to September talks in Washington despite the clear escalation seen. The report cites Wei Jianguo, former vice-minister of commerce, noting that the meeting is likely to happen, with video conferences planned to set the groundwork before the next round of face-to-face talks.
Fed's Evans defends dovish stance: Chicago Fed President Charles Evans, who is a voting member, keeps supporting the notion that further rate cuts may be needed by stating that “economic headwinds mean cutting rates further could be reasonable,'' adding that “on the basis of the low US inflation alone, July interest rate cut was justified and more policy accommodation needed.” On the hot topic of the trade war, Evans said that the brinkmanship trade negotiations mean volatility, which is why attention is required to guard the economy against spillover effects. Evans sees a midcycle adjustment as Fed now aims for 50 basis points below neutral rate, rather than 50 bp above.
US President Trump keeps bashing on the Fed Another round of tweets by Mr. President, where he places the blame on the Fed for not cutting rates deeper. The tweet, for anyone who is experienced in covering market news, is an insult to our own intelligence, as he demands that the Fed must stop QT (Quantitative Tightening), when it’s formal conclusion was already announced in the last FOMC meeting, while mentioning that the US yield curve is “at too wide a margin”, which is absolute nonsense since the inversion dynamics are across the board and the narrowest since pre GFC (Global Financial Crisis).
Trump’s tweet read: “Three more Central Banks cut rates. Our problem is not China - We are stronger than ever, money is pouring into the U.S. while China is losing companies by the thousands to other countries, and their currency is under siege - Our problem is a Federal Reserve that is too.........proud to admit their mistake of acting too fast and tightening too much (and that I was right!). They must Cut Rates bigger and faster, and stop their ridiculous quantitative tightening NOW. Yield curve is at too wide a margin, and no inflation! Incompetence is a.........terrible thing to watch, especially when things could be taken care of sooo easily. We will WIN anyway, but it would be much easier if the Fed understood, which they don't, that we are competing against other countries, all of whom want to do well at our expense!”
Most important juncture in FX in decades? Raoul Pal, Founder/CEO at RealVision and well-respected Global Macro Investor, has put out a series of tweets that have really caught my attention. In them, Raoul notes that “We are at the most important juncture in FX markets in my entire 30-year career.” Read on here.
Recent Economic Indicators & Events Ahead
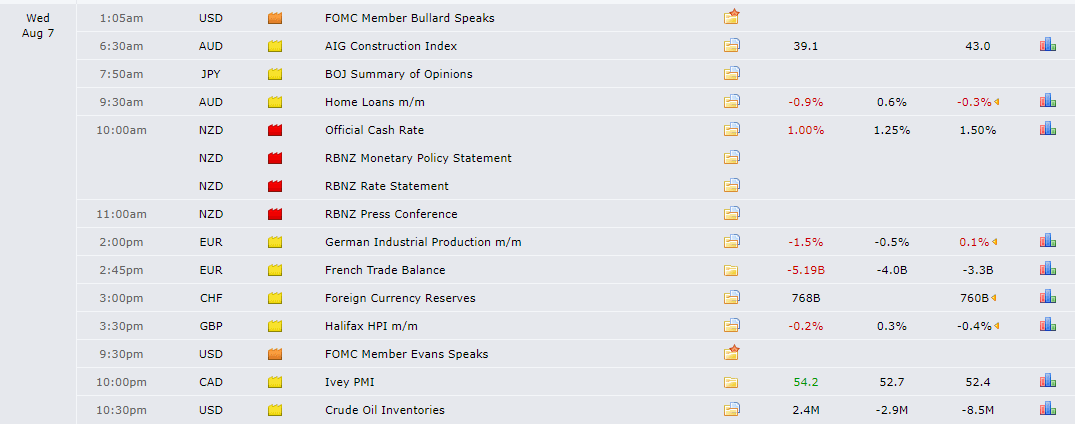
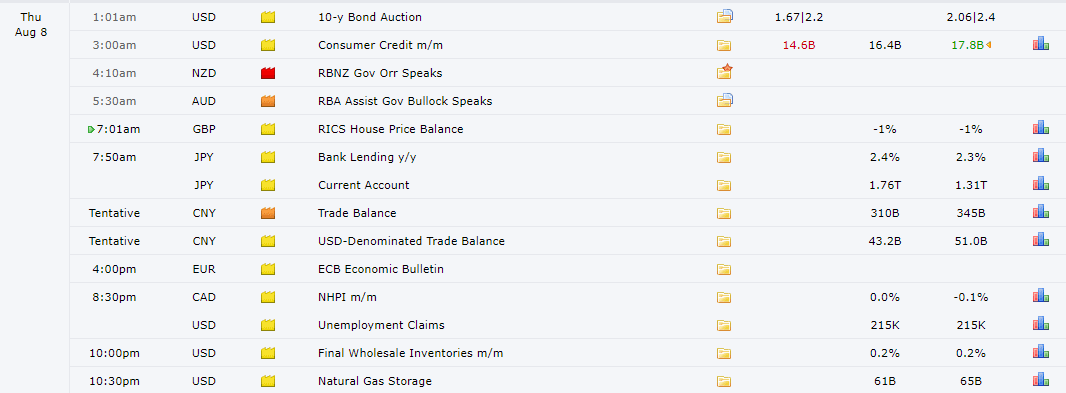
Source: Forexfactory
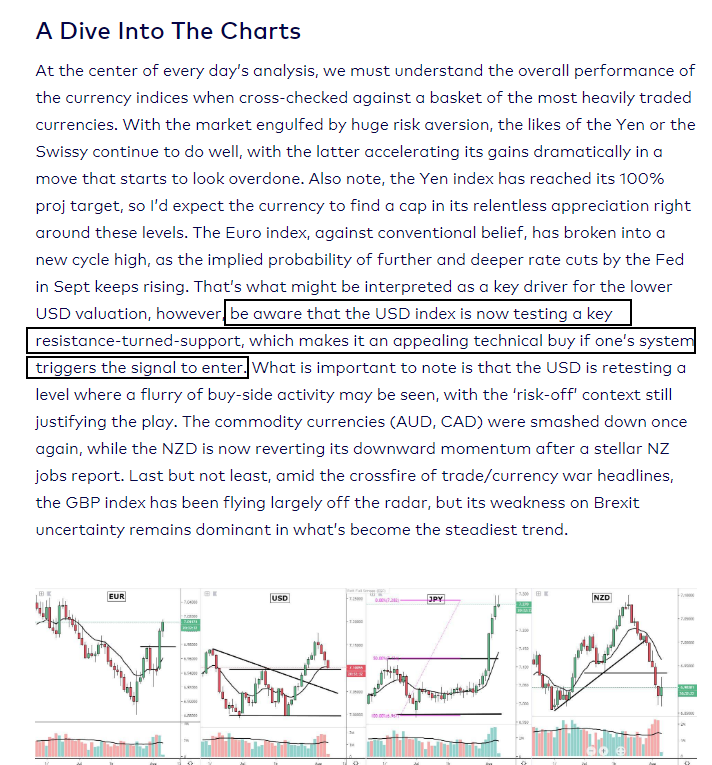
A Dive Into The Charts
By disseminating the latest currency movements in its index terms against a basket of G8 FX, we can understand the overall market sentiment and where turns are most likely to occur. An educational article about how to build your own currency meter can be found in the Global Prime's Research section. For instance, the unwinding of low yielding currencies (EUR, JPY, CHF) used for the funding of carry trades appears to have reached a technical inflection point in the charts. This leads me to think the heat might start coming off these outperformers as derisking flows adjust to a firmer Yuan. This initial premise is predicated on the fact that all three currencies have reached macro symmetrical targets, what I often refer as 100% projection targets, which implies that we may be nearing a meaningful top, a possibility if one expects risk to recover a tad from here on out.
Next, let's ask ourselves, what’s our main barometer driving risk in today’s market dynamics? The clear answer here is the unfolding currency war, centered around the Yuan. Therefore, by scanning the USD/CNH chart, we can also obtain some clues and here we see that the pair has reached its 100% projection target, in other words, further sustained gains seem to be unlikely if abiding by the market structure logic I continuously dwell on. This assumption marries well with the rhetoric from the PBOC to stabilize the Yuan as it’s not in their best interest at all to see this type of sharp Yuan depreciation so rapidly.
Now let’s turn our attention to the high-beta currencies, which have been absolutely smashed in value for the last 3 weeks. This includes the AUD, NZD indices but I will also add GBP. Incredible but true, the moment each one landed on the 100% proj target, the market appears to have found a temporary bottom as market makers’ bids and profit-taking ensues. It tells me that short-term, the prospects to see a further recovery have some solid technical grounds.
We’ve seen the USD index finding consistent bids off its support area since Tuesday, which is an outcome I made sure readers were on high alert to watch for as per my notes earlier in the week (read below). The currency is in a bullish phase, so there is little reason not to expect further upward pressure for at least a retest of the previous resistance.
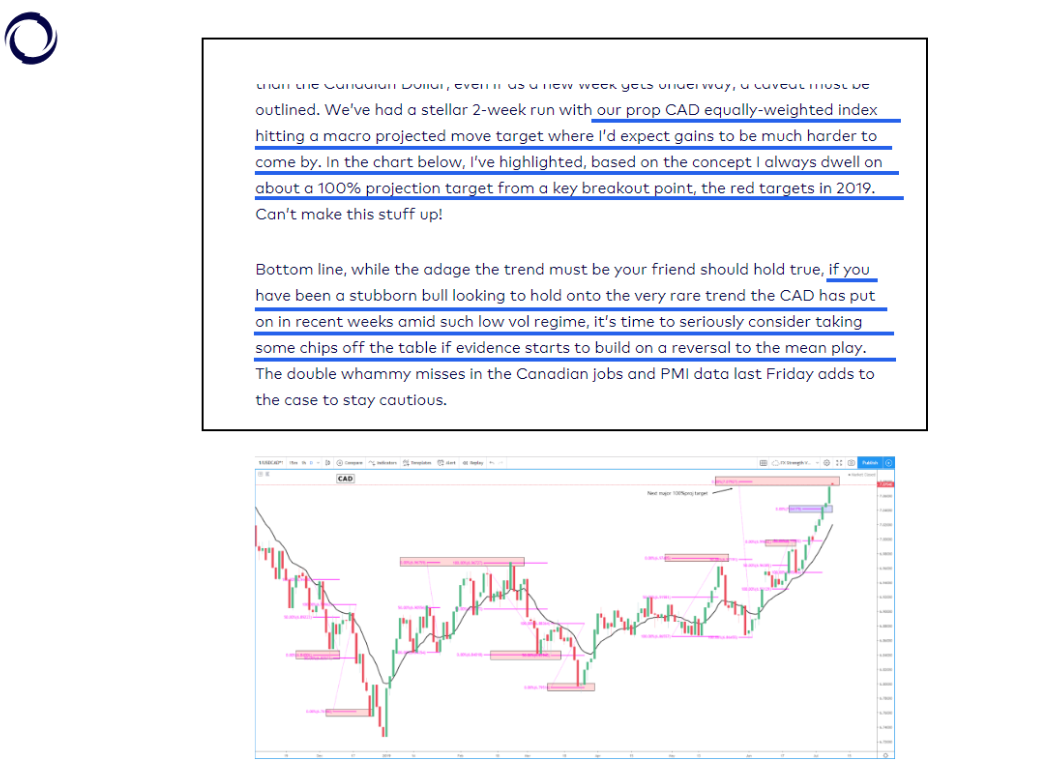
The CAD looks like it’s evolving into one of the weakest currencies out there in the G8 FX space even if a major macro area of support was found on the way down which made it an attractive proposition to play longs off of it. By the way, if you notice, the CAD index bull run of June/July stopped in its tracks at, you guessed it, the 100% projection target, location in the chart when you start to be suspicious of a reversal. Find below the notes I sent last month warning about this 100% target to find a top.
Ok, now that we’ve been able to deconstruct the overall sentiment and market structures in the main currencies, we can start to take the next step, moving from the individual technical merits of each currency index to the potential exploitation of opportunities by pairing up these currencies.
The first pair that as I scan for possible combinations to capitalize turns my alarm bells ‘on’ is the prospects of a recovery in the AUD/CHF. The pair has found a major volume absorption candle with a huge lower shadow tail at the 100% projection target. This view also plays in congruence with the tentative negative outlook on funding currencies (CHF), while it’s also backed by the more constructive view on the Aussie on the basis that the PBOC won’t allow the Yuan to weaken much further in the short-term. Note, one could also consider investigating the AUD/JPY chart, even if the absorption is not as pronounced judging by the tick volume of the rejection candle on Wednesday.
The next market to highlight is the short play in CAD/CHF as per the note I put out yesterday. This is a market that as I noted yesterday, had printed a clear rejection off the highs as the massive upper tail indicated, which coupled with the breakout and acceptance below support, made it a market with increasing risk of going through a period of follow-through supply, which is what we’ve seen (over 75 pips).
The sell-side campaign in oil has also made further inroads by extending the downside into its next area of support around the 51.00 area where I’d expect profit-taking and market makers action to start absorbing late sellers. Note, the area is the 100% proj target + key support. Upside risks may be building up short-term.
The next chart is an interesting one. The logic to have played a potential short here was to get the trigger right at the juncture when the EUR index hit resistance and the AUD index reached its 100% projection target. If one was sharp enough to marry up these 2 inflection points in the indices charts to conclude that a pair like the EUR/AUD run the clear risk of exhausting its move, you’d probably have gotten a trigger entry very near to the top. A short at the very top here clearly demonstrates that the prop currency indices, as a standalone sentiment indicator, can play a huge role in understanding when certain currency combinations can find a reversal.
Another market I have my eyes on is USD/CHF. My analysis tells me that it'd be logical to expect upward pressure as the CHF looks overstretched on an index measure, while the USD index does seem to have further upside in store as my analysis indicates. This warrants a closer inspection on USD/CHF only to realize that we’ve seen an absorption candle at a huge level of support, hence the price action evidence is also there to make me think that in the short-run, bulls may regain control for an initial target of 0.98.
Last but not least, let's briefly touch on gold as this was yet another market where the order book sweep (sudden order flow change) led me to expect an upside target of around 1,500.00 as per last Thursday when Trump went all out by imposing further tariffs to China from Sept 1. Find a screenshot of my note below.
Fast forward to the last NY close...
Important Footnotes
- Risk model: The fact that financial markets have become so intertwined and dynamic makes it essential to stay constantly in tune with market conditions and adapt to new environments. This prop model will assist you to gauge the context that you are trading so that you can significantly reduce the downside risks. To understand the principles applied in the assessment of this model, refer to the tutorial How to Unpack Risk Sentiment Profiles
- Cycles: Markets evolve in cycles followed by a period of distribution and/or accumulation. To understand the principles applied in the assessment of cycles, refer to the tutorial How To Read Market Structures In Forex
- POC: It refers to the point of control. It represents the areas of most interest by trading volume and should act as walls of bids/offers that may result in price reversals. The volume profile analysis tracks trading activity over a specified time period at specified price levels. The study reveals the constant evolution of the market auction process. If you wish to find out more about the importance of the POC, refer to the tutorial How to Read Volume Profile Structures
- Tick Volume: Price updates activity provides great insights into the actual buy or sell-side commitment to be engaged into a specific directional movement. Studies validate that price updates (tick volume) are highly correlated to actual traded volume, with the correlation being very high, when looking at hourly data. If you wish to find out more about the importance tick volume, refer to the tutorial on Why Is Tick Volume Important To Monitor?
- Horizontal Support/Resistance: Unlike levels of dynamic support or resistance or more subjective measurements such as fibonacci retracements, pivot points, trendlines, or other forms of reactive areas, the horizontal lines of support and resistance are universal concepts used by the majority of market participants. It, therefore, makes the areas the most widely followed and relevant to monitor. The Ultimate Guide To Identify Areas Of High Interest In Any Market
- Trendlines: Besides the horizontal lines, trendlines are helpful as a visual representation of the trend. The trendlines are drawn respecting a series of rules that determine the validation of a new cycle being created. Therefore, these trendline drawn in the chart hinge to a certain interpretation of market structures.
- Correlations: Each forex pair has a series of highly correlated assets to assess valuations. This type of study is called inter-market analysis and it involves scoping out anomalies in the ever-evolving global interconnectivity between equities, bonds, currencies, and commodities. If you would like to understand more about this concept, refer to the tutorial How Divergence In Correlated Assets Can Help You Add An Edge.
- Fundamentals: It’s important to highlight that the daily market outlook provided in this report is subject to the impact of the fundamental news. Any unexpected news may cause the price to behave erratically in the short term.
- Projection Targets: The usefulness of the 100% projection resides in the symmetry and harmonic relationships of market cycles. By drawing a 100% projection, you can anticipate the area in the chart where some type of pause and potential reversals in price is likely to occur, due to 1. The side in control of the cycle takes profits 2. Counter-trend positions are added by contrarian players 3. These are price points where limit orders are set by market-makers. You can find out more by reading the tutorial on The Magical 100% Fibonacci Projection