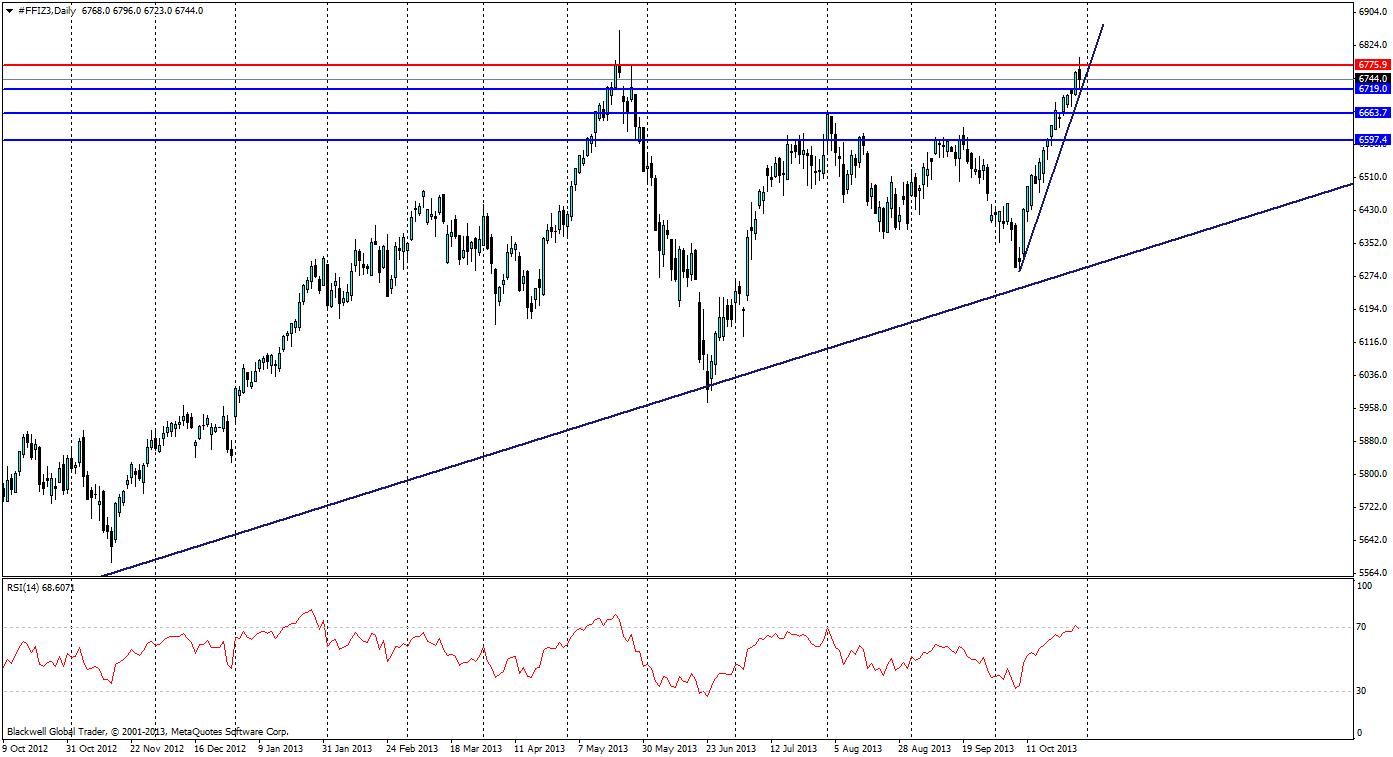
The FTSE 100 is presenting a great opportunity in the last few days as it has climbed rapidly to touch on a major resistance level at 6776.0. After the recent last few years of quantitative easing globally and the asset purchase program at home in the UK, the markets are awash with cash looking for a return and the equity markets benefited heavily. This has led to the FTSE 100 being a major benefactor and a bullish trend has been in place over the last three years.
Currently looking at the RSI, we can see buying pressure has been intense over the last few weeks as economic sentiment in the UK has been very strong. But the real question is, have buyers overextended themselves in the equity markets to push to this record high? All previous touches at the 70 mark on the RSI have led to minor pullbacks – this looks likely to occur again if the pair fails to break through tomorrow.
The bullish trend is very sharp and steep on the daily chart and looks like it could break over the next 24 hours if there is a reversal, the weekly trend though is still remaining very strong and I would expect this to continue in the long run due to the fundamentals being strong at home in the UK after the recent positive sentiment from jobless report and manufacturing, which showed an upsurge in recent months as the UK recovery picked up pace.

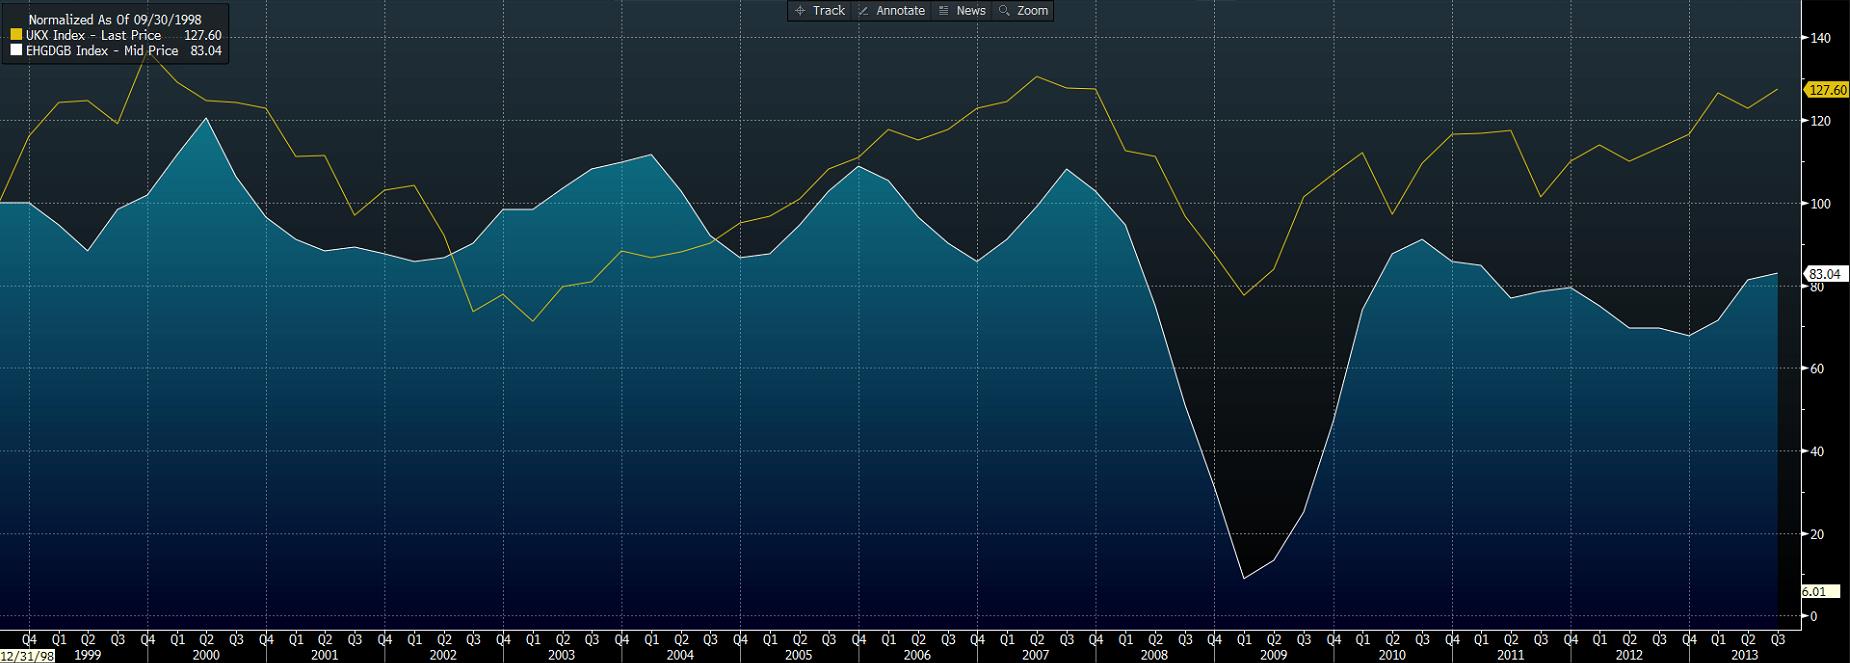
Source: Bloomberg
When looking at real GDP growth compared to the FTSE 100, we can see that there is a clear divergence from 2009 onwards, which in turn adds weight to the over-valuation that is apparent in the market. As real GDP growth, sitting at 1.5% does not match the current growth rate in the FTSE 100 when compared historically to the correlation of the two, leading to what many analysts believe to be an over valuation of the FTSE 100 as a whole.
Looking at resistance levels, the clear one can be found at 6776.00 – this level has not seen a candle close past it since 2000 and looks likely to hold after yesterday’s pull back. The Support levels can be found at 6720.0, 6663.00 and 6608.00, each of these should be treated as strong support levels as markets will most likely resist pulling away from the recent highs.
Looking forward, I see it as unlikely that the FTSE 100 will be able to break through its current resistance level – even with all the money floating around out there from QE. And I would certainly look for a pullback in equities when tapering comes about.
Written by Alex Gurr, Currency Analyst with Blackwell Global.
- English (UK)
- English (India)
- English (Canada)
- English (Australia)
- English (South Africa)
- English (Philippines)
- English (Nigeria)
- Deutsch
- Español (España)
- Español (México)
- Français
- Italiano
- Nederlands
- Português (Portugal)
- Polski
- Português (Brasil)
- Русский
- Türkçe
- العربية
- Ελληνικά
- Svenska
- Suomi
- עברית
- 日本語
- 한국어
- 简体中文
- 繁體中文
- Bahasa Indonesia
- Bahasa Melayu
- ไทย
- Tiếng Việt
- हिंदी
FTSE Futures: Great Trading Opportunity
Published 10/31/2013, 07:13 AM
Updated 05/14/2017, 06:45 AM
FTSE Futures: Great Trading Opportunity
3rd party Ad. Not an offer or recommendation by Investing.com. See disclosure here or
remove ads
.
Latest comments
Very c l e v e r !. . I think, { The Dow 30 & The FTSE 100} are run by the same tera-super computer.. {SP 500 & DAX 30}, are run by the other tera-super C.
There are certainly comparisons between the Dow and the FTSE. The fundamentals however, don't match either's valuation. But for now the technical's certainly look in charge.
They have certainly all have been over inflated by QE. For the moment though, with weak fundamentals to justify there prices, the markets are playing out via technicals.
Install Our App
Risk Disclosure: Trading in financial instruments and/or cryptocurrencies involves high risks including the risk of losing some, or all, of your investment amount, and may not be suitable for all investors. Prices of cryptocurrencies are extremely volatile and may be affected by external factors such as financial, regulatory or political events. Trading on margin increases the financial risks.
Before deciding to trade in financial instrument or cryptocurrencies you should be fully informed of the risks and costs associated with trading the financial markets, carefully consider your investment objectives, level of experience, and risk appetite, and seek professional advice where needed.
Fusion Media would like to remind you that the data contained in this website is not necessarily real-time nor accurate. The data and prices on the website are not necessarily provided by any market or exchange, but may be provided by market makers, and so prices may not be accurate and may differ from the actual price at any given market, meaning prices are indicative and not appropriate for trading purposes. Fusion Media and any provider of the data contained in this website will not accept liability for any loss or damage as a result of your trading, or your reliance on the information contained within this website.
It is prohibited to use, store, reproduce, display, modify, transmit or distribute the data contained in this website without the explicit prior written permission of Fusion Media and/or the data provider. All intellectual property rights are reserved by the providers and/or the exchange providing the data contained in this website.
Fusion Media may be compensated by the advertisers that appear on the website, based on your interaction with the advertisements or advertisers.
© 2007-2024 - Fusion Media Limited. All Rights Reserved.
