
FTI Consulting (NYSE:FCN) delivered solid second-quarter 2019 results, with both earnings and revenues beating the Zacks Consensus Estimate.
Adjusted earnings per share of $1.73 beat the Zacks Consensus Estimate by 78 cents and increased 51.8% on a year-over-year basis. The bottom line benefited from strong operating performance by the company’s Corporate Finance & Restructuring, Economic Consulting and Technology segments.
Total revenues of $606.1 million beat the consensus mark by $49 million and increased 18.4% year over year. The increase was driven by higher demand across all business segments and regions, and higher success fees.
Shares of the company have gained a massive 57.7% year to date, significantly outperforming the 34.7% rally of the industry it belongs to.

Let’s check the numbers in detail.
Revenues by Segment
Corporate Finance & Restructuring segment revenues increased 34.4% year over year to $190 million. The upside was driven by higher demand for business transformation and transactions, restructuring services, and higher success fees. The segment contributed 31% to total revenues.
Forensic and Litigation Consulting segment revenues increased 9.2% year over year to $145.9 million. The improvement came on the back of higher demand for health solutions, construction solutions and disputes services. The segment contributed 24% to total revenues.
Strategic Communications segment revenues increased 2.8% year over year to $59.1 million. The upside was driven by increase in project-based revenues in North America and EMEA, primarily associated with corporate reputation services. The segment contributed 10% to total revenues.
Economic Consulting segment revenues increased 16.6% year over year to $155.5 million. The increase was supported by higher demand for antitrust services in North America and EMEA. The segment contributed 26% to total revenues.
Technology segment revenues increased 19.8% year over year to $55.6 million. The increase was driven by higher demand for cross-border investigations. The segment contributed 9% to total revenues.
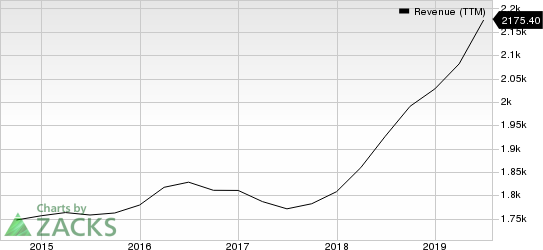
FTI Consulting, Inc. Revenue (TTM)
Operating Results
Adjusted EBITDA came in at $97.2 million, up 34.3% on a year-over-year basis. The increase was driven by higher revenues and improved utilization, partially offset by an increase in compensation expenses and selling, general and administrative (SG&A) expenses. Adjusted EBITDA margin increased to 16% from 14.1% in the prior-year quarter.
Balance Sheet and Cash Flow
FTI Consulting exited the quarter with cash and cash equivalents of $189.1 million compared with $179.2 million in the prior quarter. Long-term debt was $290.5 million compared with $268 million at the end of the prior quarter.
The company generated $47.6 million of net cash from operating activities and capex was $10.5 million in the quarter. It spent $48.3 million to repurchase 579,771 shares in the quarter.
2019 Guidance
Management raised adjusted EPS and revenue guidance for the year. Adjusted EPS is now anticipated in the range of $5-$5.50 compared with the previous guidance of $4. The mid-point ($5.25) of the revised guided range is lower than the Zacks Consensus Estimate of $5.42.
Management now expects revenues in the range of $2.175-$2.250 billion, compared with the previous guidance of at least $2.1 billion. The mid-point of the current range ($2.21 billion) is lower than the Zacks Consensus Estimate of $2.25 billion.
Zacks Rank & Stocks to Consider
Currently, FTI Consulting carries a Zacks Rank #1 (Strong Buy). You can see the complete list of today’s Zacks #1 Rank stocks here.
Some other top-ranked stocks in the broader Zacks Business Services sector include Broadridge (NYSE:BR) , Accenture (NYSE:ACN) and Total System Services (NYSE:TSS) , each carrying a Zacks Rank #2 (Buy).
The long-term expected EPS (three to five years) growth rate for Broadridge, Accenture and Total System is 10%, 10.3% and 12.1%, respectively.
More Stock News: This Is Bigger than the iPhone!
It could become the mother of all technological revolutions. Apple (NASDAQ:AAPL) sold a mere 1 billion iPhones in 10 years but a new breakthrough is expected to generate more than 27 billion devices in just 3 years, creating a $1.7 trillion market.
Zacks has just released a Special Report that spotlights this fast-emerging phenomenon and 6 tickers for taking advantage of it. If you don't buy now, you may kick yourself in 2020.
Click here for the 6 trades >>
FTI Consulting, Inc. (FCN): Free Stock Analysis Report
Accenture PLC (ACN): Free Stock Analysis Report
Broadridge Financial Solutions, Inc. (BR): Free Stock Analysis Report
Total System Services, Inc. (TSS): Free Stock Analysis Report
Original post