Frontline Ltd. (FRO) is a shipping company. The Company is engaged primarily in the ownership and operation of oil tankers and oil/bulk/ore (OBO) carriers.
This is a vol, order flow and stock price note all based on a research report that came out Friday. Here's the news as summarized by Briefing:
"Frontline: Tanker rates to be very well supported in the coming weeks - Dahlman Rose
Dahlman Rose notes, there has been a surge in spot market activity during the past week with Saudi Aramco's shipping arm. The firm says, the overall fundamentals of the tanker market remain weak due to new building supply outpacing global import demand growth this year, but this dynamic is likely to take a back seat in the coming months as more oil flows in an effort to minimize the impact of lost Iranian oil will take hold. As such they expect tanker rates to be very well supported in the coming weeks, which positions spot-exposed tanker companies to realize their highest 2Q earned rates since perhaps 2008." -- Source: Provided by briefing.com
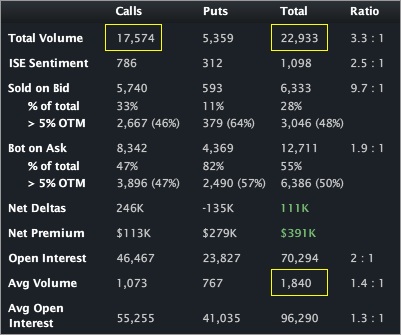
That news has pushed vol up nearly 50% and the stock up more than 22%. let's start with the order flow. The company has traded nearly 23,000 contracts on total daily average option volume of just 1,840. Calls have traded in a 3.3:1 ratio to puts. The Stats Tab and Day's biggest trades snapshots are included (below).

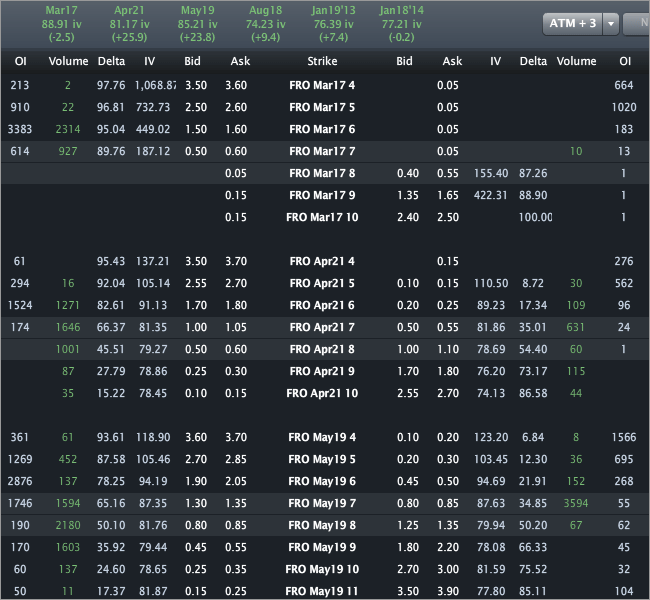
The Options Tab (below) illustrates the action. There look to be opening positions in the Apr 7 and 8 calls as well as the May 8 and 9 calls (compare OI to trade size). All but the May 9 calls appear to be substantially purchases. The May 9 calls are ambiguous, but my best guess would actually be sales.
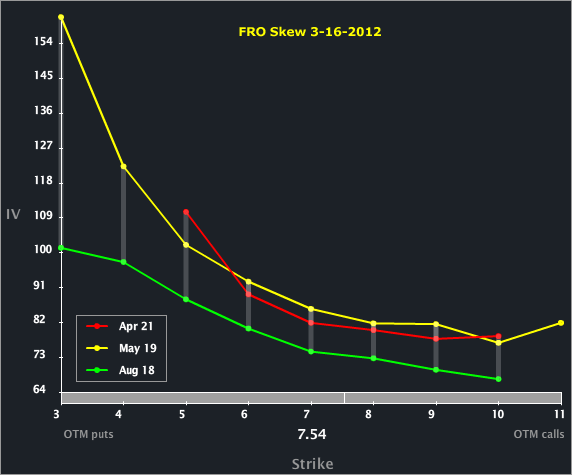
The Skew Tab snap (below) illustrates the vols by strike by month.
The shapes across the months are consistent and "normal." The upside calls haven't reacted so abruptly as to break the shape of the term structures.
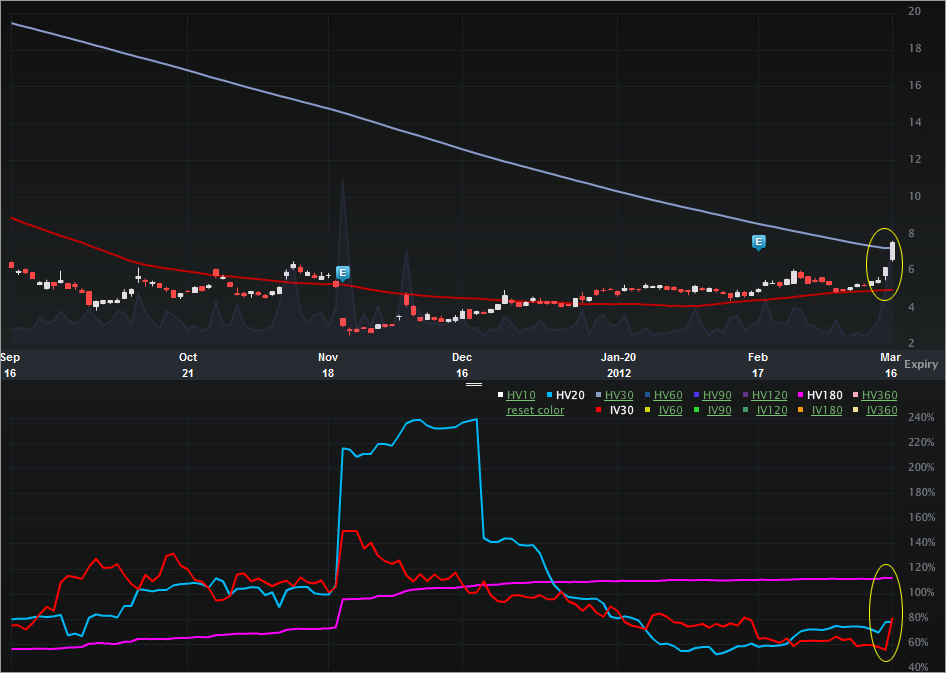
Finally, the Charts Tab (6 months) is below. The top portion is the stock price, the bottom is the vol (IV30™ - red vs HV20™ - blue vs HV180™ - pink). 
On the stock side we can see the recent rally that has seen the stock rise from $5.49 as of two days ago, to now over $7.50. That's more than 37% in two trading days. On the vol side, we can can see how the implied has popped with the stock today -- up nearly 50%. It is interesting to note that even with this vol pop, the IV30™ is still in the 42nd percentile (annual).
In terms of 52 wk ranges, try this: The stock price annual range is [$2.52, $24.86]. Gulp... The IV30™ annual range is [28.68%, 153.13%]. Double gulp...
Disclosure: This is trade analysis, not a recommendation
- English (UK)
- English (India)
- English (Canada)
- English (Australia)
- English (South Africa)
- English (Philippines)
- English (Nigeria)
- Deutsch
- Español (España)
- Español (México)
- Français
- Italiano
- Nederlands
- Português (Portugal)
- Polski
- Português (Brasil)
- Русский
- Türkçe
- العربية
- Ελληνικά
- Svenska
- Suomi
- עברית
- 日本語
- 한국어
- 简体中文
- 繁體中文
- Bahasa Indonesia
- Bahasa Melayu
- ไทย
- Tiếng Việt
- हिंदी
Frontline Stock and Vol Pop on Industry Report
Published 03/18/2012, 04:07 AM
Updated 07/09/2023, 06:31 AM
Frontline Stock and Vol Pop on Industry Report
3rd party Ad. Not an offer or recommendation by Investing.com. See disclosure here or
remove ads
.
Latest comments
Install Our App
Risk Disclosure: Trading in financial instruments and/or cryptocurrencies involves high risks including the risk of losing some, or all, of your investment amount, and may not be suitable for all investors. Prices of cryptocurrencies are extremely volatile and may be affected by external factors such as financial, regulatory or political events. Trading on margin increases the financial risks.
Before deciding to trade in financial instrument or cryptocurrencies you should be fully informed of the risks and costs associated with trading the financial markets, carefully consider your investment objectives, level of experience, and risk appetite, and seek professional advice where needed.
Fusion Media would like to remind you that the data contained in this website is not necessarily real-time nor accurate. The data and prices on the website are not necessarily provided by any market or exchange, but may be provided by market makers, and so prices may not be accurate and may differ from the actual price at any given market, meaning prices are indicative and not appropriate for trading purposes. Fusion Media and any provider of the data contained in this website will not accept liability for any loss or damage as a result of your trading, or your reliance on the information contained within this website.
It is prohibited to use, store, reproduce, display, modify, transmit or distribute the data contained in this website without the explicit prior written permission of Fusion Media and/or the data provider. All intellectual property rights are reserved by the providers and/or the exchange providing the data contained in this website.
Fusion Media may be compensated by the advertisers that appear on the website, based on your interaction with the advertisements or advertisers.
© 2007-2024 - Fusion Media Limited. All Rights Reserved.
