During the first week of May every year, the maxim, “Sell in May and Go Away,” gets taken out, dusted off and powered up as a reason to sell stocks. The rhyme is more than just a catchy urban legend: June, July, August and September have historically been the weakest months of the year for the S&P 500 Index.
Yet even if seasons trigger certain events, when the snow falls in Minnesota in May, Midwesterners need to throw on their winter gear and roll out snowblowers, not lawnmowers.
S&P Streaks
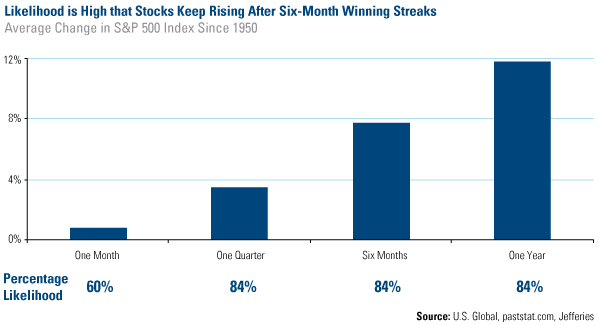
Consider this encouraging research: The S&P 500 has been rallying for six months in a row, which has happened 48 times since 1950. Following these six-month winning streaks, stocks have historically continued rising. Sixty percent of the time, the S&P 500 climbed 0.79 percent over the next month; 84 percent of the time, stocks increased 3.50 percent, 7.77 percent and 11.77 percent the next three, six and 12 months following the streak.
In addition, 165,000 jobs were added to payrolls in April, helping the unemployment rate fall to 7.5 percent. This is the lowest level since December 2008.
The news comes days after the Federal Reserve stamped its approval on another month of bond buying, with the added bonus of Ben Bernanke stating that the Fed is “prepared to increase or reduce the pace of its purchases to maintain appropriate policy accommodation.”
If that’s not enough to validate a continuing bull market, consider the European Central Bank’s exceptional move this week. Mario Draghi cut key interest rates to 0.5 percent, the first time in 10 months, following weaker manufacturing data out of top four largest economies in the euro zone. Germany, France, Italy and Spain all experienced manufacturing contractions.
Our portfolio manager of the Emerging Europe Fund, Tim Steinle, described the ECB’s motivation this way: It’s one thing to punish the periphery; it’s another to weaken the core.
Sector Underperformers
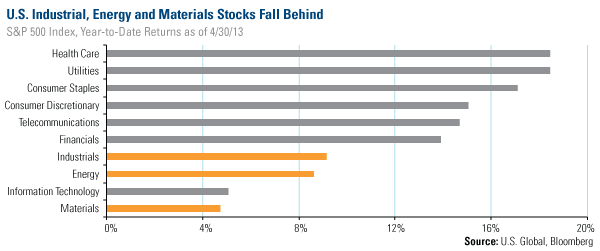
The S&P 500 has climbed an amazing 12.74 percent through April 30, so if you’re eager to do some investment spring cleaning, you might want to consider areas that have underperformed. For example, take a look at the year-to-date returns by sector, which reveal an interesting pattern. Health care, utilities, consumer staples and consumer discretionary have all climbed more than 15 percent, much more than the market. Meanwhile, companies in the materials, energy and industrials sectors have lagged the overall index.
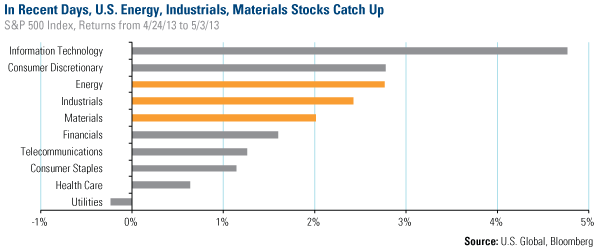
In recent days, an inflection point seems to have occurred, with these weaker areas of the market gaining strength. We wrote in Investor Alert last week that cyclical stocks, including health care, consumer staples, utilities and telecommunication, have been lagging the remaining sectors. From the beginning of the earnings season on April 24 through May 3, energy, industrial and materials stocks are nearly the best performing areas of the market.
We believe expectations might have become too lofty for defensive companies and too gloomy for cyclical stocks, so as perceptions toward global growth improve, it won’t take much for energy, industrials and materials to take off.
Also Read: A Case for Owning Commodities When No One Else Is
Spring Clean Your Treasury Portfolio Too
With the Fed’s insistence to keep interest rates low, real interest rates remain negative for investors. For example, a 90-day T-bill yields 0.06 percent and 2-year Treasury yields 0.23 percent, but inflation burns off 1.5 percent.
It’s interesting to note that while low interest rates help keep the government’s debt payments low, these rates hurt seniors living on a fixed income. My friend, Terry Savage writes this week,
“Savers are the big losers in this rigged game. And most domestic savers are seniors and those approaching retirement, who planned to live on the income generated by their savings. Today, that’s simply not possible – unless they are willing to take on a lot more risk.”
Here’s an alternative that offers both a shorter duration and higher yields, without a lot of risk: The Near-Term Tax Free Fund (NEARX) has a tax-equivalent yield of 1.51 percent as of March 31, 2013. Its 30-day SEC yield is 0.81 percent. These yields are significantly higher than a 2-year Treasury.
The important idea for investors is to adjust to the current conditions. Regardless of the month, if the thermostat shows frigid temperatures, dress accordingly. Likewise for when it’s hot in the summer. What’s important is to stay tuned and make sure your portfolio is dressed accordingly.
Want to receive more investment research like this? Sign up to receive email updates from Frank Holmes and the rest of the U.S. Global Investors team, follow us on Twitter or like us on Facebook.
Disclaimer:
Please consider carefully a fund’s investment objectives, risks, charges and expenses. For this and other important information, obtain a fund prospectus by visiting www.usfunds.com or by calling 1-800-US-FUNDS (1-800-873-8637). Read it carefully before investing. Distributed by U.S. Global Brokerage, Inc.
Foreign and emerging market investing involves special risks such as currency fluctuation and less public disclosure, as well as economic and political risk. By investing in a specific geographic region, a regional fund’s returns and share price may be more volatile than those of a less concentrated portfolio. The Emerging Europe Fund invests more than 25% of its investments in companies principally engaged in the oil & gas or banking industries. The risk of concentrating investments in this group of industries will make the fund more susceptible to risk in these industries than funds which do not concentrate their investments in an industry and may make the fund’s performance more volatile.
Tax-exempt income is federal income tax free. A portion of this income may be subject to state and local income taxes, and if applicable, may subject certain investors to the Alternative Minimum Tax as well. Each tax free fund may invest up to 20% of its assets in securities that pay taxable interest. Income or fund distributions attributable to capital gains are usually subject to both state and federal income taxes. Bond funds are subject to interest-rate risk; their value declines as interest rates rise. The tax free funds may be exposed to risks related to a concentration of investments in a particular state or geographic area. These investments present risks resulting from changes in economic conditions of the region or issuer.
The S&P 500 Stock Index is a widely recognized capitalization-weighted index of 500 common stock prices in U.S. companies.
- English (UK)
- English (India)
- English (Canada)
- English (Australia)
- English (South Africa)
- English (Philippines)
- English (Nigeria)
- Deutsch
- Español (España)
- Español (México)
- Français
- Italiano
- Nederlands
- Português (Portugal)
- Polski
- Português (Brasil)
- Русский
- Türkçe
- العربية
- Ελληνικά
- Svenska
- Suomi
- עברית
- 日本語
- 한국어
- 简体中文
- 繁體中文
- Bahasa Indonesia
- Bahasa Melayu
- ไทย
- Tiếng Việt
- हिंदी
Forget The Cliche! Here's Why You Should Stay
Published 05/06/2013, 03:43 PM
Updated 07/09/2023, 06:31 AM
Forget The Cliche! Here's Why You Should Stay
3rd party Ad. Not an offer or recommendation by Investing.com. See disclosure here or
remove ads
.
Latest comments
Good article! intellligent are selling while the others just follow media which is trying to sell us a DOW in 15000, but with all the reports to Warren Buffett...DOW closed down, and Utilities are telling you: danger, danger, sell
Install Our App
Risk Disclosure: Trading in financial instruments and/or cryptocurrencies involves high risks including the risk of losing some, or all, of your investment amount, and may not be suitable for all investors. Prices of cryptocurrencies are extremely volatile and may be affected by external factors such as financial, regulatory or political events. Trading on margin increases the financial risks.
Before deciding to trade in financial instrument or cryptocurrencies you should be fully informed of the risks and costs associated with trading the financial markets, carefully consider your investment objectives, level of experience, and risk appetite, and seek professional advice where needed.
Fusion Media would like to remind you that the data contained in this website is not necessarily real-time nor accurate. The data and prices on the website are not necessarily provided by any market or exchange, but may be provided by market makers, and so prices may not be accurate and may differ from the actual price at any given market, meaning prices are indicative and not appropriate for trading purposes. Fusion Media and any provider of the data contained in this website will not accept liability for any loss or damage as a result of your trading, or your reliance on the information contained within this website.
It is prohibited to use, store, reproduce, display, modify, transmit or distribute the data contained in this website without the explicit prior written permission of Fusion Media and/or the data provider. All intellectual property rights are reserved by the providers and/or the exchange providing the data contained in this website.
Fusion Media may be compensated by the advertisers that appear on the website, based on your interaction with the advertisements or advertisers.
© 2007-2024 - Fusion Media Limited. All Rights Reserved.
