
Sometimes following where money is being invested is a solid course of action to gain alpha; other times, a better opportunity lies in going the opposite direction, i.e., thinking contrarian.
Take commodities, energy and materials, which may be the most unappreciated areas of the market these days. According to Bank of America Merrill Lynch’s Global Fund Manager Survey of 250 participants who collectively manage $725 billion, energy, materials and commodities are extremely underowned.
As you can see below, the global asset class positioning during the first week of April compared to historical data shows that energy positions are close to 3 standard deviations below the long-term average. An allocation to materials is more than 2 standard deviations below its long-term average and commodity exposure is close to 2 standard deviations below its historical measure.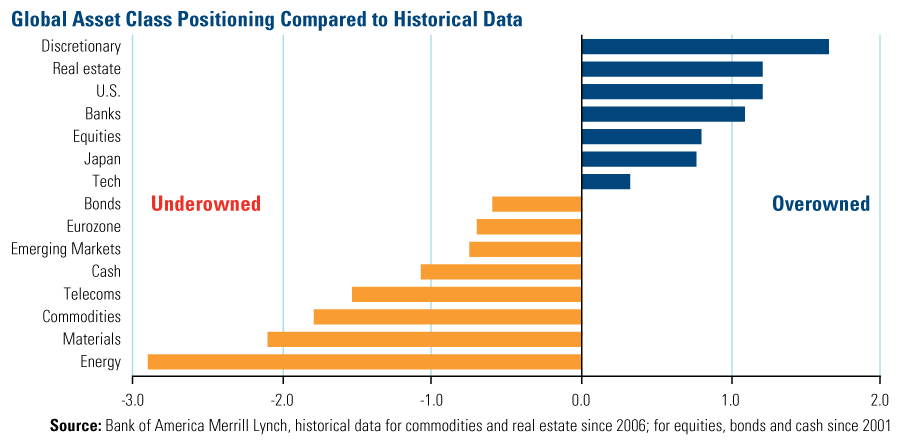
Take note of the timing, though, as it appears that it may make sense to own the most underowned areas of the market. Compare today’s portfolio weightings to the last time fund managers had such a significant underweight in these asset classes. Each bar below indicates whether allocations in energy represented a net overweight or underweight position. Most of the time since 2003, managers maintained an overweight allocation, which means they likely anticipated outperformance in energy companies during this period of time.
However, the last time they had such a big underweight in global energy for this long was at the end of 2008 and the beginning of 2009.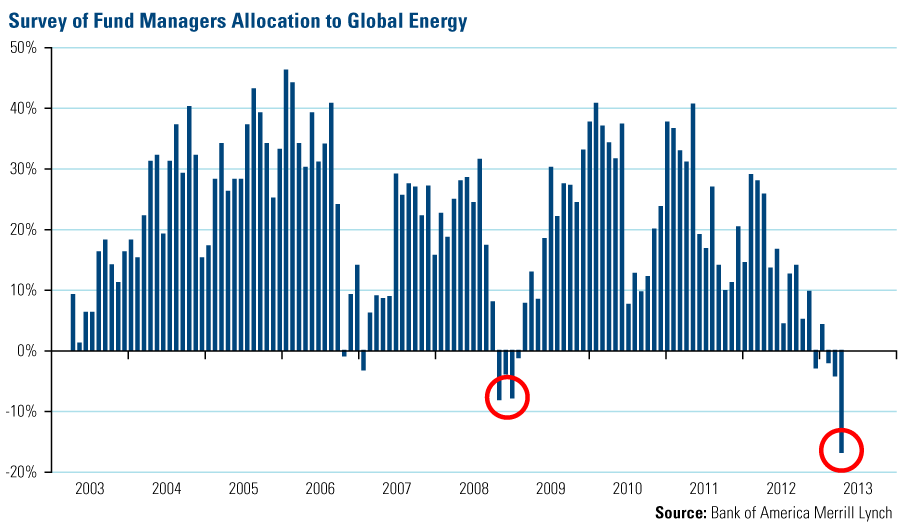
In materials, there were many more times that managers chose to have an underweight allocation to the sector. But again, the magnitude of today’s allocation decision matches what we saw in the 2008-2009 timeframe.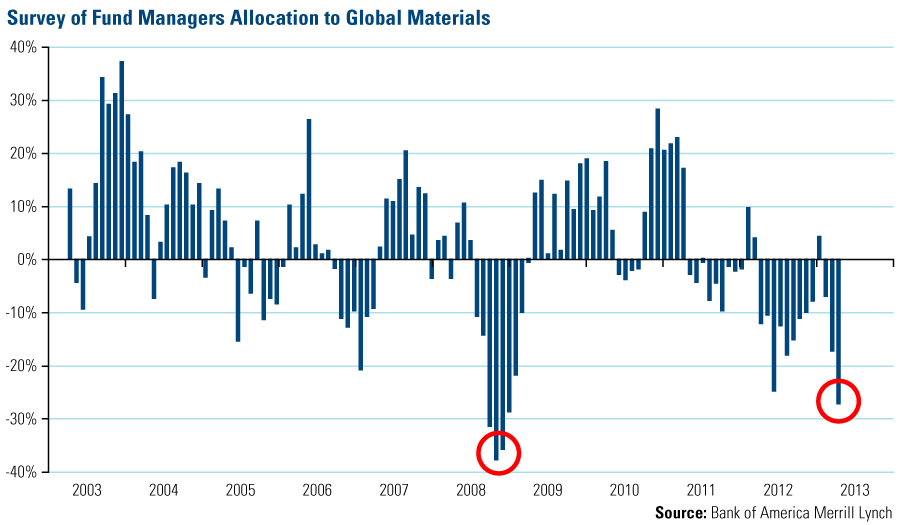
A similar picture for commodities reveals this consistent trend. Asset allocation indicating an overweighting in commodities hasn’t been this negative since 2008-2009.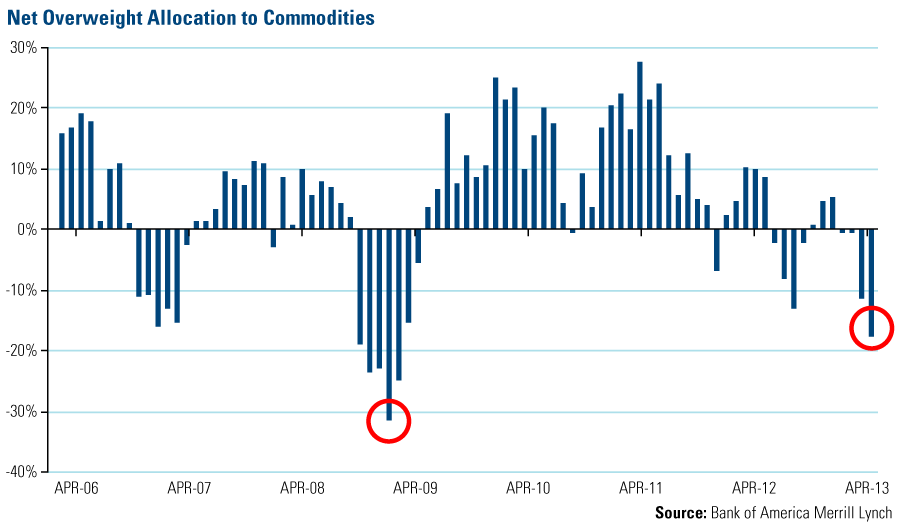
Given the historical trend in late 2008 and early 2009 when managers were invested in other areas of the market, many likely missed the huge rally in natural resources stocks. From the market bottom on March 9, 2009, the Morgan Stanley Commodity Related Equity Index of commodity stocks (CRX) grew 156 percent on a cumulative basis over the next two years. This is more than twice the return of the commodities futures index, the Dow Jones-UBS Commodity Index.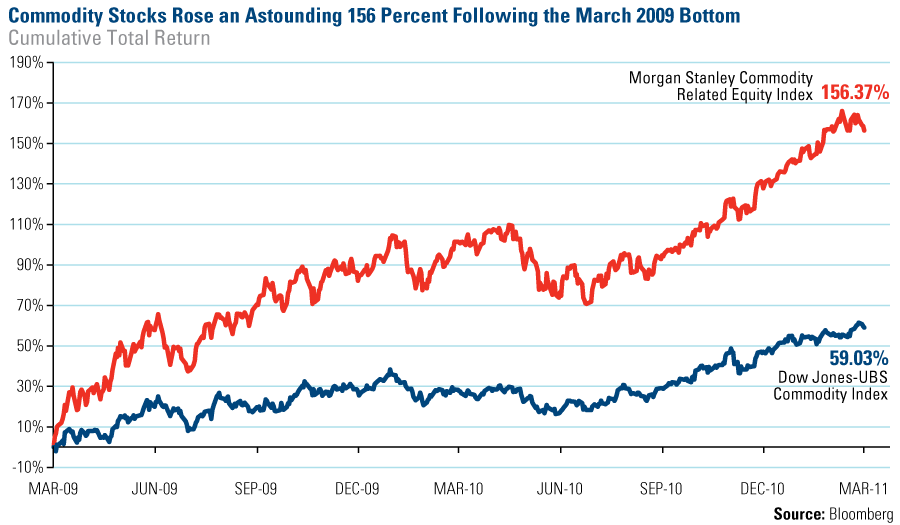
Don’t miss the next potential rally. In one investment, the Global Resources Fund (PSPFX) gives you exposure to all three of these underowned segments of the market. It’s a multi-faceted approach to energy and materials stocks across 10 distinct industries to aim for lower volatility and better growth potential.
We believe the commodity supercycle continues, driven by emerging countries experiencing rising urbanization, increasing wealth and healthy GDP growth rates. What’s important for investors to remember is to build a diversified basket of natural resources companies actively managed by professionals who understand the seasonal and cyclical trends of these specialized assets.
Please consider carefully a fund’s investment objectives, risks, charges and expenses. For this and other important information, obtain a fund prospectus by visiting www.usfunds.com or by calling 1-800-US-FUNDS (1-800-873-8637). Read it carefully before investing. Distributed by U.S. Global Brokerage, Inc. Past performance does not guarantee future results.
Foreign and emerging market investing involves special risks such as currency fluctuation and less public disclosure, as well as economic and political risk. Because the Global Resources Fund concentrates its investments in a specific industry, the fund may be subject to greater risks and fluctuations than a portfolio representing a broader range of industries.
The Dow Jones UBS Commodity Index is composed of futures contracts on physical commodities, and includes commodities traded on U.S. exchanges, with the exception of aluminum, nickel and zinc, which trade on the London Metal Exchange (LME). The Morgan Stanley Commodity Related Index (CRX) is an equal-dollar weighted index of 20 stocks involved in commodity related industries such as energy, non-ferrous metals, agriculture, and forest products. The index was developed with a base value of 200 as of March 15, 1996. Standard deviation is a measure of the dispersion of a set of data from its mean. The more spread apart the data, the higher the deviation. Standard deviation is also known as historical volatility. Diversification does not protect an investor from market risks and does not assure a profit.
- English (UK)
- English (India)
- English (Canada)
- English (Australia)
- English (South Africa)
- English (Philippines)
- English (Nigeria)
- Deutsch
- Español (España)
- Español (México)
- Français
- Italiano
- Nederlands
- Português (Portugal)
- Polski
- Português (Brasil)
- Русский
- Türkçe
- العربية
- Ελληνικά
- Svenska
- Suomi
- עברית
- 日本語
- 한국어
- 简体中文
- 繁體中文
- Bahasa Indonesia
- Bahasa Melayu
- ไทย
- Tiếng Việt
- हिंदी
A Case for Owning Commodities When No One Else Is
Published 05/02/2013, 03:13 AM
Updated 07/09/2023, 06:31 AM
A Case for Owning Commodities When No One Else Is
Latest comments
Loading next article…
Install Our App
Risk Disclosure: Trading in financial instruments and/or cryptocurrencies involves high risks including the risk of losing some, or all, of your investment amount, and may not be suitable for all investors. Prices of cryptocurrencies are extremely volatile and may be affected by external factors such as financial, regulatory or political events. Trading on margin increases the financial risks.
Before deciding to trade in financial instrument or cryptocurrencies you should be fully informed of the risks and costs associated with trading the financial markets, carefully consider your investment objectives, level of experience, and risk appetite, and seek professional advice where needed.
Fusion Media would like to remind you that the data contained in this website is not necessarily real-time nor accurate. The data and prices on the website are not necessarily provided by any market or exchange, but may be provided by market makers, and so prices may not be accurate and may differ from the actual price at any given market, meaning prices are indicative and not appropriate for trading purposes. Fusion Media and any provider of the data contained in this website will not accept liability for any loss or damage as a result of your trading, or your reliance on the information contained within this website.
It is prohibited to use, store, reproduce, display, modify, transmit or distribute the data contained in this website without the explicit prior written permission of Fusion Media and/or the data provider. All intellectual property rights are reserved by the providers and/or the exchange providing the data contained in this website.
Fusion Media may be compensated by the advertisers that appear on the website, based on your interaction with the advertisements or advertisers.
© 2007-2024 - Fusion Media Limited. All Rights Reserved.