Talking Points
Foreign Exchange Price & Time at a Glance:

Charts Created using Marketscope – Prepared by Kristian Kerr
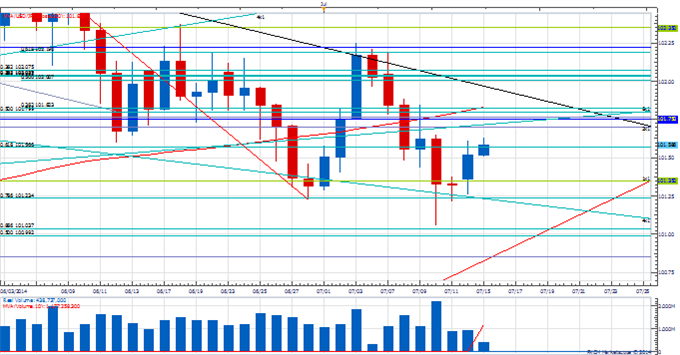
- USD/JPY has moved modestly higher over the past few days following last week’s reversal from the 101.05 88.6% retracement of the May to June advance
- Our near-term trend bias is still higher in the exchange rate
- A move over 102.25 is needed to confirm the start of a more meaningful push higher
- A cycle turn window is eyed next week
- Any weakness under 101.05 would re-focus lower
USD/JPY Strategy: Square, but would look to buy a break of 102.25 and 102.80.
|
Instrument |
Support 2 |
Support 1 |
Spot |
Resistance 1 |
Resistance 2 |
|
USD/JPY |
*101.05 |
101.35 |
101.55 |
*102.25 |
102.80 |

Charts Created using Marketscope – Prepared by Kristian Kerr
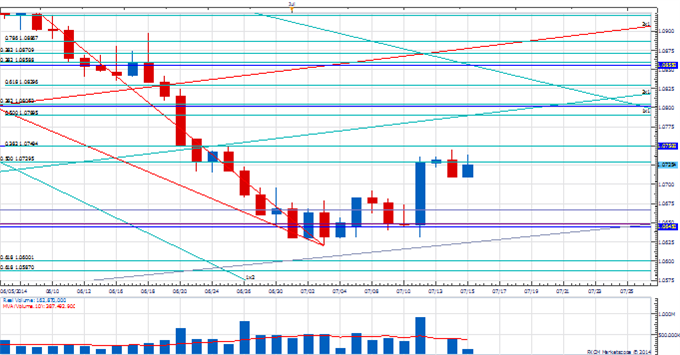
- USD/CAD reversed last week from a key confluence zone near 1.0600/50
- Our near-term trend bias is now higher in Funds
- A push through the 38% retracement of the June/July decline at 1.0750 is needed to set off a new leg higher
- A minor cycle turn window is eyed early next week
- A daily close under 1.0630 would turn us negative again on USD/CAD
USD/CAD Strategy: Like buying Funds on weakness against 1.0630.
|
Instrument |
Support 2 |
Support 1 |
Spot |
Resistance 1 |
Resistance 2 |
|
USD/CAD |
*1.0630 |
1.0700 |
1.0725 |
*1.0750 |
1.0790 |

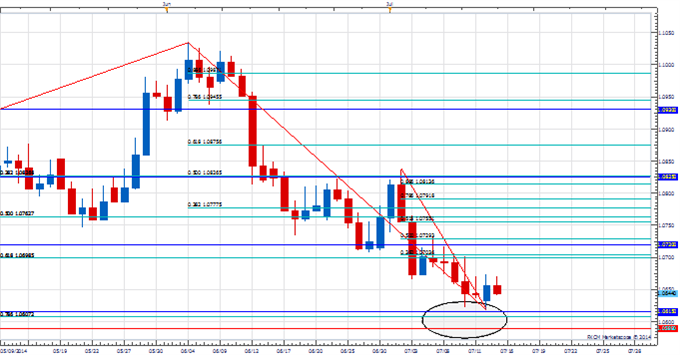
We are watching the AUD/NZD crossrate closely this week. One of our favorite cyclical intervals is “Pi” or 3,141 days. Some remarkable reversals have occurred on the interval with perhaps the most well known one being the high in the US equity market in 2000 which occurred 3,141 trading days from the low following the 1987 crash. The past weekend AUD/NZD reached 3,141 calendar days from the major low recorded in December of 2005. On Monday the cross touched a new 4-month low before reversing sharply from just above the 4th square root relationship of the year’s high at 1.0620 to record an “outside day” on the daily chart. An interesting first step, but in no way anything definitive. Follow through over the next few days will be important with strength over 1.0675 and then 1.0700 needed to signal that the cross is undergoing something more than just a natural correction. Renewed weakness below another square root relationship at 1.0590 would seriously undermine any remaining potential for a more serious turn.
This publication attempts to further explore the concept that mass movements of human psychology, as represented by the financial markets, are subject to the mathematical laws of nature and through the use of various geometric, arithmetic, statistical and cyclical techniques a better understanding of markets and their corresponding movements can be achieved.
--- Written by Kristian Kerr, Senior Currency Strategist for DailyFX.com
