• FOMC meeting: A breath ahead of a possible rate hike The Fed will take center stage with the much-anticipated policy meeting. Market participants are already aligned behind the first hike in nearly a decade and the recent flow of economic data offer no reason to hold back. The solid improvement in the labour market, the rise in the inflation and the strong US outlook are the main reasons behind the expected interest rate increase. Moreover, the policy makers want to act now as they fear that if they postpone the first hike, the tightening cycle may not be as gradual as they want. Currently, the market assigns approximately 80% probability of a hike, which gives the impression of a done deal. Therefore, the focus will turn to the ‘dot plot’ and the pace of the future rate hikes. A ‘lazy rate hike’ where the initial hike would be followed by a prolonged pause, could take some of the steam out of USD strength. On the other hand, an aggressive liftoff path, within short intervals could prove very bullish for the greenback. September’s median ‘dots’ show the initial hike in December and four additional hikes next year. Compared with the current market pricing, which prices only close to three hikes now until year-end 2016, the ‘dots’ are much more hawkish than market expectations. Even if we have a modest downside revision of the ‘dots’, the rate path signal could still be more aggressive than the current market expectations. In our view, this still leaves room for short-term yields to increase and hence room for the dollar to strengthen. Nevertheless, along with the new ‘dots’, we see the possibility that the statement and Fed Chair Yellen’s press conference to indicate a ‘dovish hike’. The dollar’s reaction will be highly dependent on the signalled path of future policy, which we expect to be gradual as Fed officials mentioned several times.
• Today’s highlights: The most important indicator of the day will be the UK employment report for October. The forecast is for the unemployment rate to have remained unchanged, while average weekly earnings are expected to have decelerated. However, earnings are by nature very volatile and we do not think that a possible slowdown is a sign of weakness. Given that the UK had a negative inflation for the same month, real wage growth is still strong. Thus, a solid jobs report could support GBP.
• From Europe, we get the preliminary manufacturing and service-sector PMI data for December from several European countries and the Eurozone as a whole. All the indices are forecast to remain unchanged or decline, with the only exception being the German manufacturing PMI, where expectations are for a marginal increase. A decline in most preliminary PMI indices could weaken the bloc’s common currency, at least temporarily. Eurozone’s final CPI data for November are also being released. As usual, the final figure is expected to confirm the preliminary estimate, thus the market reaction could be muted.
• In the US, besides the FOMC meeting, housing starts are forecast to have increased, while the more forward-looking building permits are expected to have declined slightly in November. The industrial production data also for November are forecast to show a decline, but at a slower pace than previously. The US preliminary Markit manufacturing PMI for December is coming out as well, but the market generally pays more attention to the ISM manufacturing index. Regardless, investors will most likely look through this data as the focus will be on the FOMC meeting later in the day.
• As for the speakers, Fed Chair Yellen holds a press conference following the FOMC decision.
The Market
EUR/USD tumble and fall to 1.0900
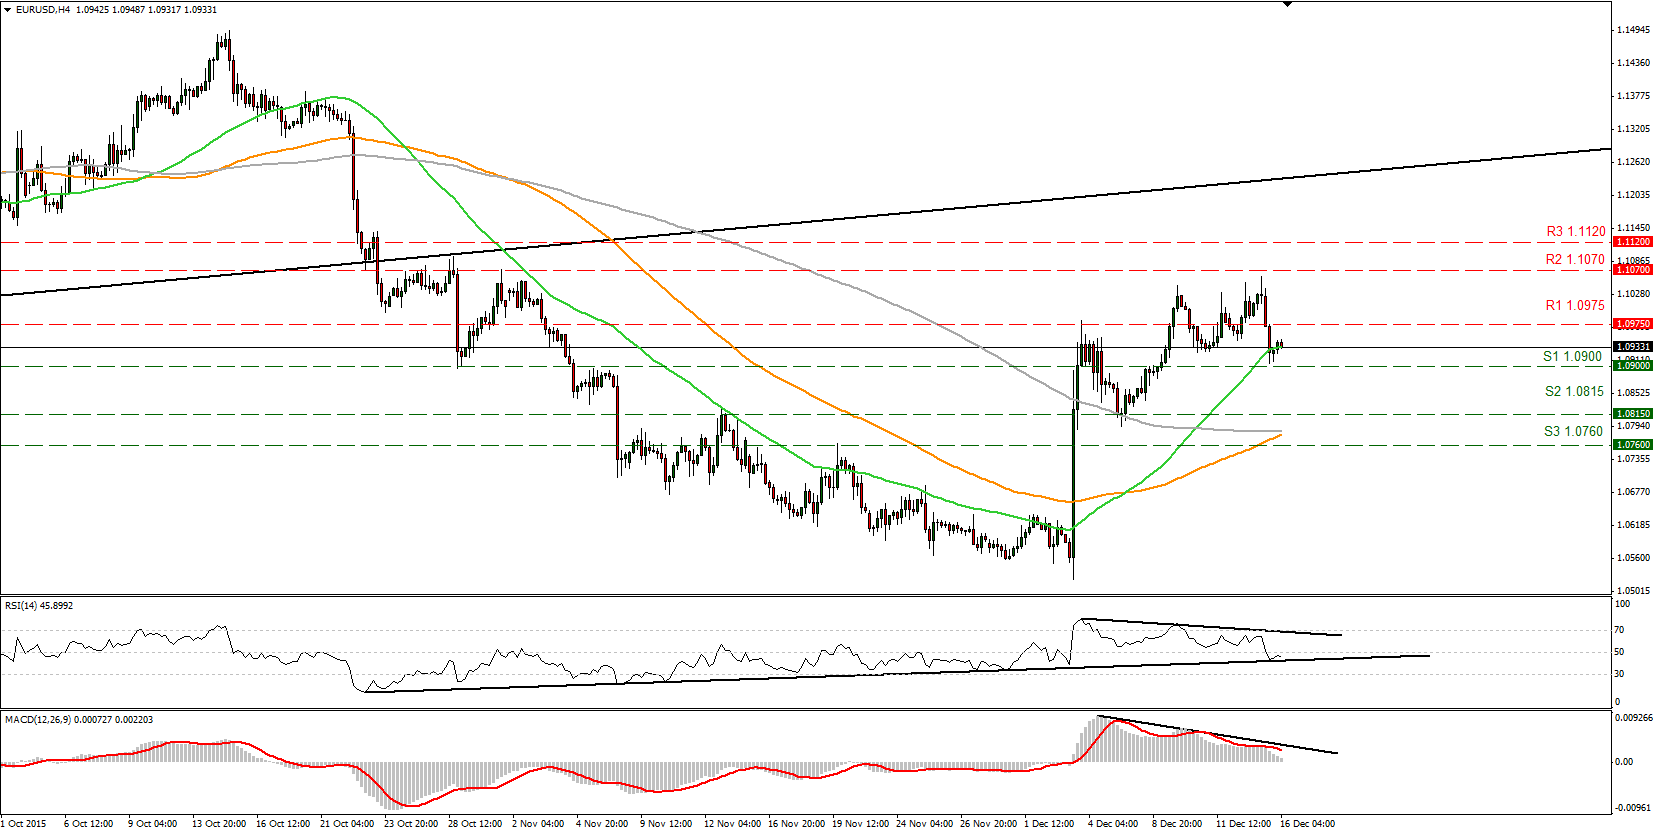
• EUR/USD tumbled on Tuesday after hitting resistance slightly below our 1.1070 (R2) level. The move was halted near the 1.0900 (S1) support area. A clear break below that area could trigger larger bearish extensions and perhaps target our next support at 1.0815 (S2). Also, the sharp fall on Tuesday confirmed the negative divergence between our short-term oscillators and the price action. Looking at our short-term oscillators the RSI fell below its 50-level and found support at the black uptrend line, while the MACD, continued to decline and it is now just above its zero line. These momentum signs support my view that we could see EUR/USD trading a bit lower, at least until the 1.0815 (S2) territory. Switching to the daily chart, the pair still trades above the 1.0800 barrier, the lower bound of the range it had been trading from the last days of April until the 6th of November. As a result, I prefer to take a neutral stance as far as the overall outlook of EUR/USD is concerned.
• Support: 1.0900 (S1), 1.0815 (S2), 1.0760 (S3)
• Resistance: 1.0975 (R1), 1.1070 (R2), 1.1120 (R3)
EUR/GBP in a consolidative mode
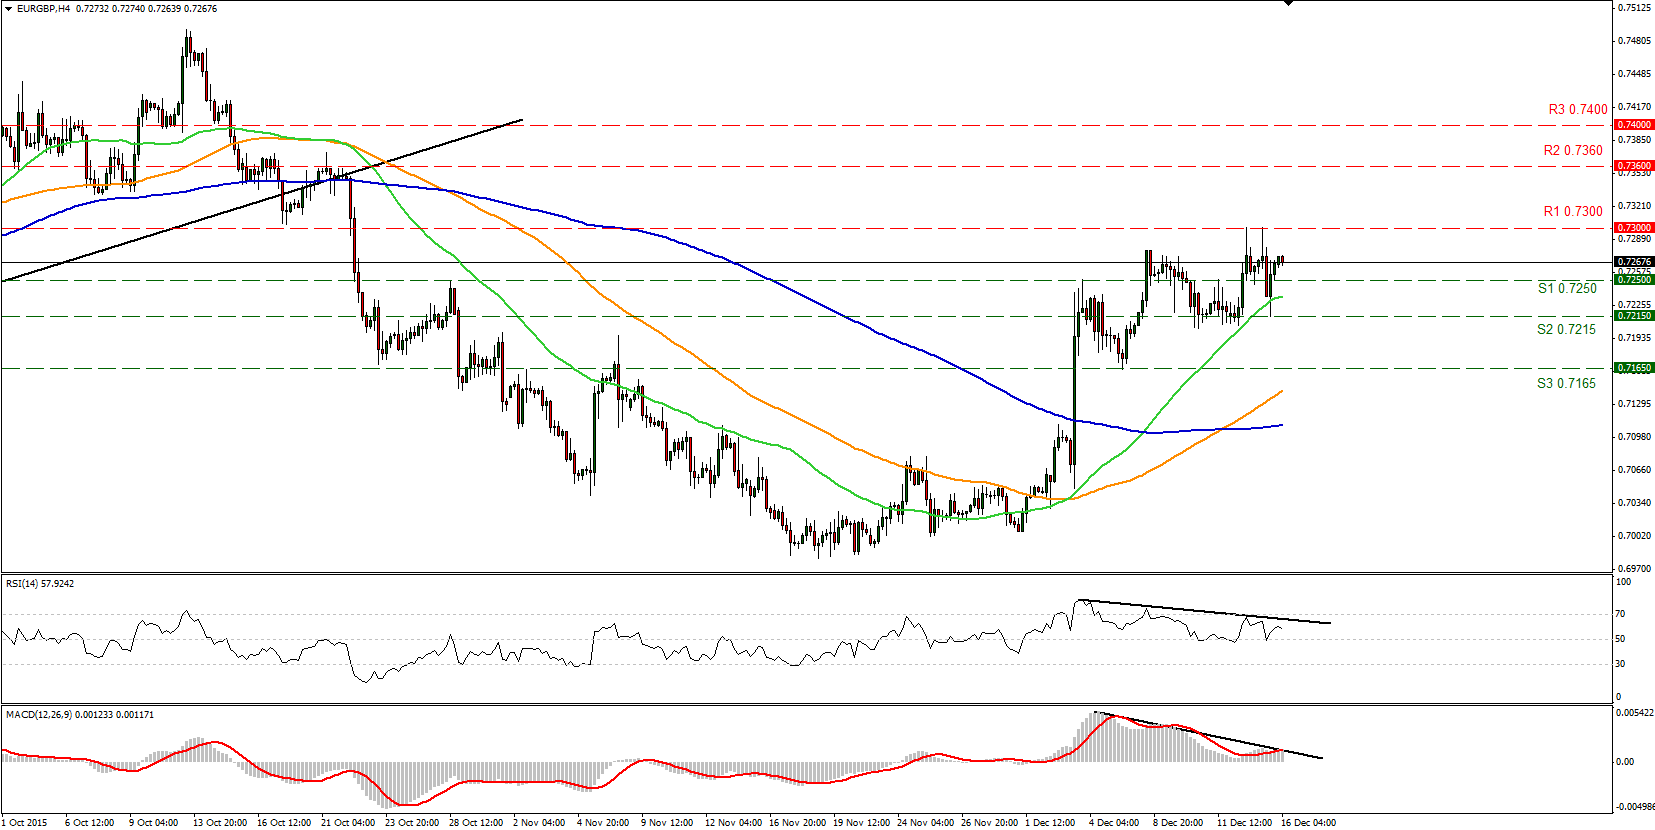
• EUR/GBP made two attempts to break above the resistance line of 0.7300 (R1) but none of them found much support and the pair is now back again in a consolidative mode, staying between the support barriers of 0.7250 (S1) and the aforementioned resistance line. The price structure on the 4-hour chart still suggest a short-term uptrend and therefore, it is possible that the bulls will regain control and aim for a break of the 0.7300 (R1) area. Shifting my attention to our short-term oscillators though, I see signs that a pullback could be looming before buyers seize control again. The trigger for the pullback could be a solid UK jobs report. The RSI turned down after it hit resistance slightly below its 70 line, while the MACD has topped and shows signs of falling below its trigger line. What is more, there is negative divergence between both these indicators and the price action, which support the case of a pullback. Switching to the daily chart, I see that the rate has been trading within a wide sideways range between the 0.6980 support area and the resistance zone of 0.7485. As a result, although I see a near-term uptrend, I would like to hold a “wait and see” stance as far as the overall outlook of this pair is concerned.
• Support: 0.7250 (S1), 0.7215 (S2), 0.7165 (S3)
• Resistance: 0.7300 (R1), 0.7360 (R2), 0.7400 (R3)
USD/JPY to test the key 122.20 level
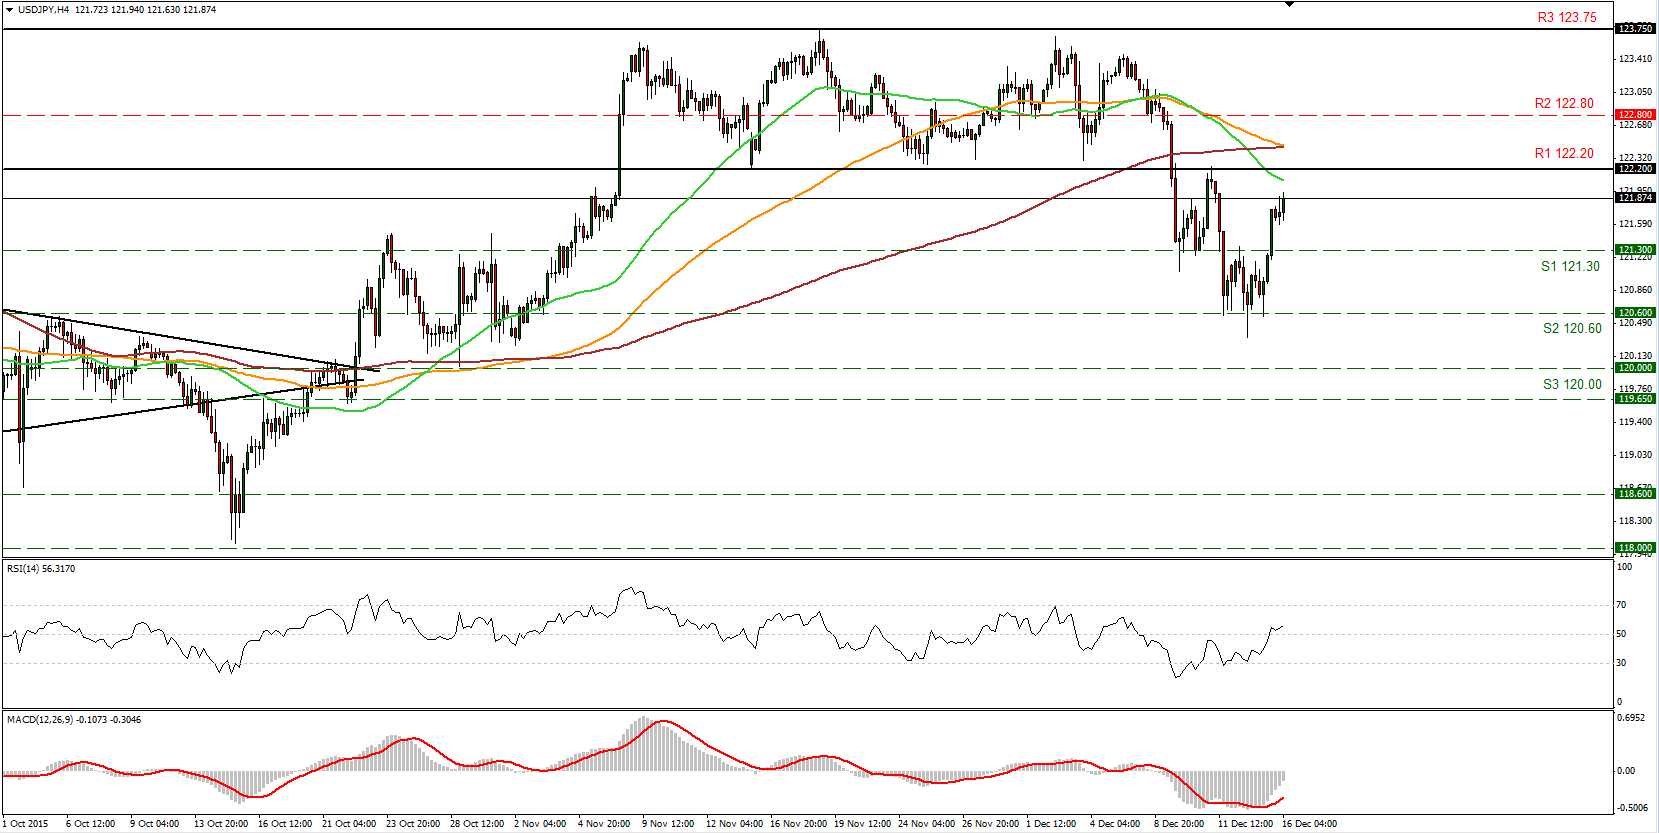
• USD/JPY surged on Tuesday breaking above the resistance-turned-into-support of 121.30 (S1). The pair currently heads for a test of the key 122.20 (R1) resistance line, which has been the lower boundary of the sideways range the rate has been trading since the 6th of November. A break above that key area is needed to shift the bias from negative to neutral and perhaps challenge our next resistance around 122.80 (R2). Taking a look at our short-term momentum signs, the RSI edged above the 50-level and points up, while the MACD, although in its negative territory crossed above its trigger line and seems willing to break above zero anytime soon. As for the broader trend, the break below the 122.20 (R1), the lower boundary of the sideways range mentioned before, has shifted the bias to the downside, in my view.
• Support: 121.30 (S1), 120.60 (S2), 120.00 (S3)
• Resistance: 122.20 (R1), 122.80 (R2), 123.75 (R3)
DAX futures rise near the 10500 zone
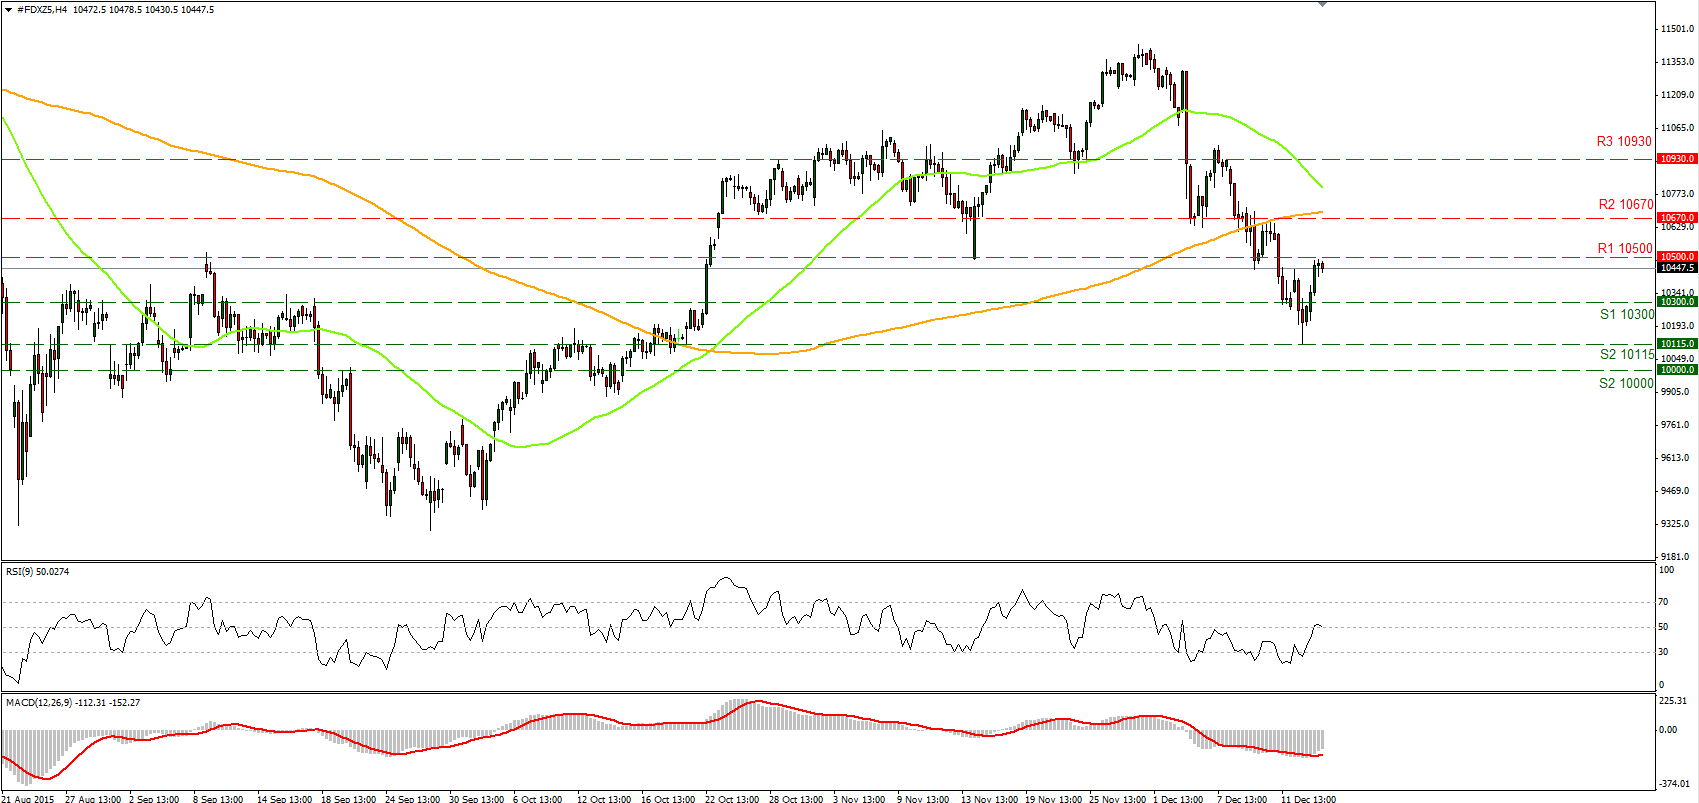
• DAX futures rose yesterday but the advance was stopped near the psychological zone of 10500 (R1). Even though the price structure on the 4-hour chart still points to a downtrend, I believe that a clear move above the 10500 (R1) barrier could trigger larger bullish extensions. Something that is likely to initially aim our next resistance at 10670 (R2). Our momentum studies however are neutral, with the RSI just above its 50 level is pointing sideways, while the MACD, although in its negative territory has bottomed and crossed above its trigger line. On the daily chart, the fall below the psychological level of 10500 (R1) on the 12th of December, has turned the medium-term picture to the downside.
• Support: 10300 (S1), 10115 (S2), 10000 (S3)
• Resistance: 10500 (R1), 10670 (R2), 10930 (R3)
Gold in a sideways mode
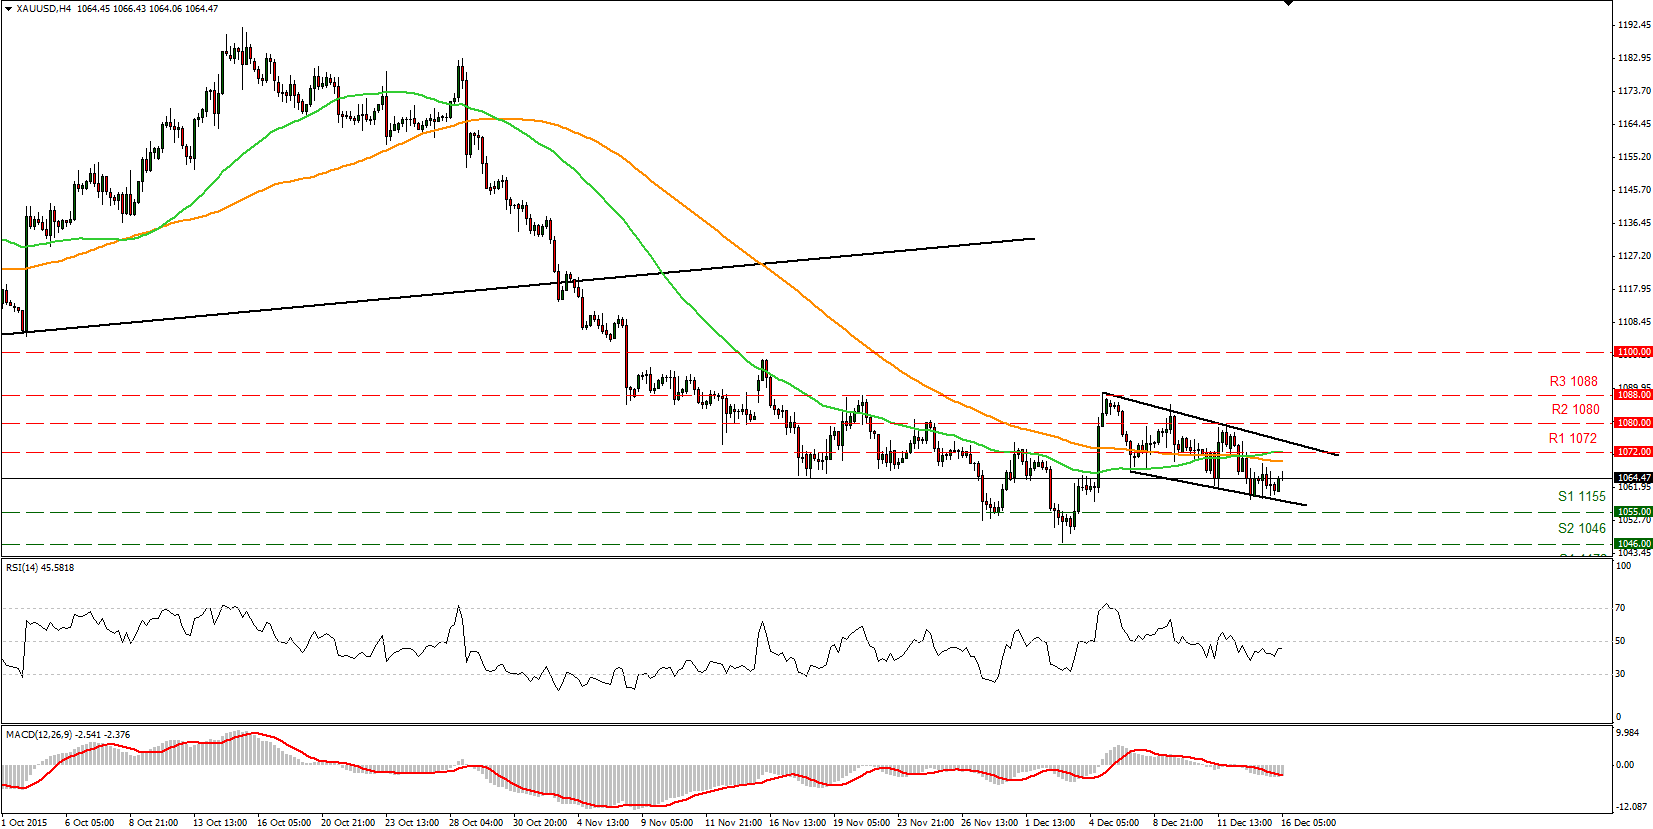
• Gold consolidated on Tuesday after hitting support at the lower boundary of the downside channel it has been trading since the 4th of December. A break below that barrier, which the precious metal failed to overcome on the 7th, 11th and 14th of December, is needed for the precious metal to extend its downside wave and perhaps aim our 1055 (S1) support line. So we have to wait and see whether the bears are strong enough to start a new attempt to push gold lower. On the daily chart, I see that the plunge below the upside support line taken from the low of the 20th of July has shifted the medium-term outlook to the downside. As a result, I believe that the metal is poised to continue its down road in the foreseeable future and I would treat any possible extensions of it, as a corrective phase for now.
• Support: 1055 (S1), 1046 (S2), 1035 (S3)
• Resistance: 1072 (R1), 1080 (R2), 1088 (R3)

