
Fitbit, Inc. (NYSE:FIT) reported third-quarter 2018 adjusted earnings of 4 cents per share, surpassing the Zacks Consensus Estimate by 5 cents.
The top line also surpassed the Zacks Consensus Estimate by 12 million.
In the quarter, Fitbit sold 3.5 million devices, up 29.6% sequentially. New products launched over the past 12 months, namely Fitbit Versa, Fitbit Charge 3, Fitbit Ace and Fitbit Aria 2, contributed 62% to the company’s revenues.
The average selling price (ASP) increased 3% from the prior-year quarter to $108 per device in the third quarter.
Management remains optimistic about smartwatch sales and expects to increase its market share in this space in the coming quarters.
Following stronger-than-expected results in the third quarter, Fitbit’s share price was up 9.51% in after-hour trading. It generated positive adjusted earnings for the first time since the third quarter of 2016, indicating a positive momentum for the company in the near future.
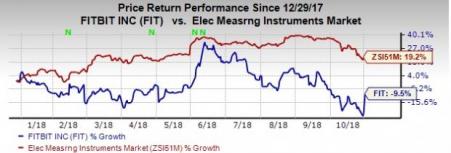
However, the stock has has lost 9.5% on a year-to-date basis against the industry’s rally of 19.2%.
Let’s check out the numbers in detail.
Revenues
Fitbit reported revenues of $394 million, up 0.3% year over year and 31.5% on a sequential basis. The top line was ahead of management’s guided range of $370-$390 and also surpassed the consensus mark of $381 million.
The strong sale of its smartwatch devices and trackers aided growth in the quarter.
Geographically, revenues from the United States accounted for 58% of third-quarter revenues, EMEA brought in 27%, Americas excluding the United States contributed 6% and the remaining 9% came from Asia Pacific.
On a sequential basis, all the regions depicted an increase, except APAC. However, on a year-over-year basis, revenues from the Asia Pacific and EMEA increased, while the same from all other regions decreased.
Margins and Net Income
Non-GAAP gross profit in the third quarter was $157.8 million. Gross margin was 40.1%, down 510 basis points year over year. Gross margins were negatively impacted by the change in mix toward smartwatches, partially offset by improved warranty costs.
Non-GAAP operating expenses were 149.5 million versus 180 million in the year-ago quarter.
Pro-forma net income was $10 million or earnings per share were 4 cents against net loss of $2.8 million or loss per share of 1 cent in the year-ago period.
Balance Sheet and Cash Flow
In the third quarter, cash and cash equivalents & Marketable securities were $623.3 million compared with $580.5 million in the second quarter.
Accounts receivables were $326 million compared with $242 million in the last reported quarter.
Cash flow from operations was $59 million and free cash flow totaled $47 million in the third quarter.
Guidance
For the fourth quarter of 2018, Fitbit expects revenues to exceed $560 million, roughly flat on a year-over-year basis. The Zacks Consensus Estimate for the same is pegged at $566.3 million.
The company expects non-GAAP earnings per share to exceed 7 cents. The corresponding Zacks Consensus Estimate is pegged at 5 cents per share.
For full-year 2018, Fitbit reiterated its revenue expectation of $1.5 billion. The Zacks Consensus Estimate for revenues is pegged at $1.49 billion.
Fitbit, Inc. Price, Consensus and EPS Surprise
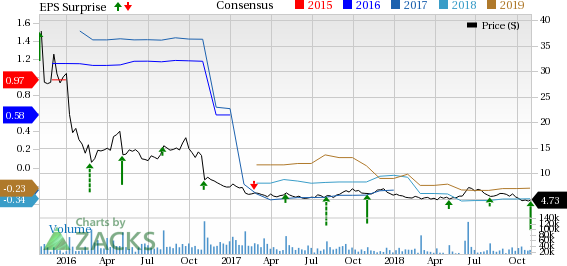
Fitbit, Inc. Price, Consensus and EPS Surprise | Fitbit, Inc. Quote
Zacks Rank and Stocks to Consider
Currently, Fitbit has a Zacks Rank #3 (Hold). Some better-ranked stocks in the broader technology sector are boohoo group plc (OTC:BHOOY) , IAC/InterActiveCorp (NASDAQ:IAC) and AMETEK, Inc. (NYSE:AME) , each carrying a Zacks Rank #2 (Buy). You can see the complete list of today’s Zacks #1 Rank (Strong Buy) stocks here.
Long-term earnings growth rate for boohoo group, IAC/InterActiveCorp and AMETEK is currently pegged at 25%, 15% and 10.97%, respectively.
Wall Street’s Next Amazon (NASDAQ:AMZN)
Zacks EVP Kevin Matras believes this familiar stock has only just begun its climb to become one of the greatest investments of all time. It’s a once-in-a-generation opportunity to invest in pure genius.
BOOHOO COM PLC (BHOOY): Free Stock Analysis Report
IAC/InterActiveCorp (IAC): Free Stock Analysis Report
Fitbit, Inc. (FIT): Free Stock Analysis Report
AMETEK, Inc. (AME): Free Stock Analysis Report
Original post
Zacks Investment Research