Solar energy solutions provider First Solar (NASDAQ:FSLR) stock saw a parabolic spike heading into 2021 thanks to the clean and renewable energy and environmental, sustainable and governance (ESG) investment themed momentum driven by the global decarbonization initiatives adopted by the Biden Administration. This included the extension of the Federal solar investment tax credit (ITC) through 2023.
However, the clean energy sector took a sharp sell-off during the NASDAQ 100 correction in Q1 2021. The maker of thin-film photovoltaic (PV) modules is one of the handful of profitable solar energy players with its own recycling and vertically integrated manufacturers with a domestic supply chain. It’s also a major benefactor of the green hydrogen economy as producers require non-carbon emitting electricity sources. Despite a number of analyst downgrades, prudent investors can monitor opportunistic pullback levels in First Solar shares to consider building a position with a tier 1 leader in the solar energy space.
Q4 2020 Earnings Release
On Feb. 25, 2021, First Solar released Q4 2020 results for the quarter ending in December 2020. The Company reported earnings per share (EPS) of $1.08 excluding non-recurring items, beating consensus analyst estimates of $1.07, by $0.01. Revenues fell (-56.5%) year-over-year (YoY) to $609.23 million, missing analyst estimates for $709.79 million. Year-end 2020 bookings rose to 1.9 GW. The Company ended the 2020 with $1.8 billion in cash, marketable securities and restricted cash, up $100 million YoY.
Full-Year 2021 Mixed Guidance
First Solar raised its full-year 2021 earnings guidance with EPS ranging between $4.05 to $4.75 versus consensus analyst estimates for $3.72. Full-year 2021 revenues are estimated between $2.85 billion to $3 billion, which include $2.45 billion to $2.55 billion in module systems net sales, compared to consensus analyst estimates for $2.99 billion. While EPS guidance was raised, top-line revenues are expected to just meet the analyst estimates, which could be interpreted as a top-line warning. The Company sees annual shipments ranging between 7.8 GW to 8 GW and CapEx spending between $425 to $75 million. Year-end 2021 net cash guidance is expected to range between $1.8 billion to $1.9 billion.
Conference Call Takeaways
First Solar CEO, Mark Widmar, set the tone:
“Over the course of 2020, we realized significant operational improvements comparing December fleet-wide metrics year-on-year, megawatts produced per day increased to 17.3 megawatts, an increase of 23%. Fleet-wide capacity utilization increased to 117%, an increase of 20 percentage points. Product yield increased to 97.6%, an increase of 3.2 percentage points. Average watts per module increased 439 watts, an increase of 9 watts. And as noted, our top production bin increased to 445 watts. Our manufacturing discipline and execution enabled us to achieve our cost per watt reduction objective (-10%) for the year.”
First Solar achieved the (-10%) cost-per watt savings despite rising volume and freight shipping costs. The Company is the top U.S. maker of thin-film PV modules and data with its legacy installs from 25 years ago demonstrating 25-year degradation rate of 48 basis points per year. This prompted the Company to extend the limited power output warranty to 30-years (from 25-years) for its Series 6 modules. The Company’s low-cost Malaysia factories are already demonstrating cap utilization rates of 80% in excess of 90% and a top production bin of 450 watts with 3 GW nameplate capacity expected by year-end 2021. The bookings momentum has continued with 3.3GW of net bookings since the October earnings call with futures expected shipments of 13.7BW into 2024. The surge in green hydrogen production, which requires renewable electricity sources, has been a strong growth driver evidenced by the increase in backlog including two additional projects in Japan totaling 51MW. The Company has 7.2GW of volume for potential deliveries in 2021, 5.9GW in 2022 and 2.3GW through 2023 and 2024.
Vertically Controlled Manufacturing and Recycling Edge
First Solar is the only company to have global in-house recycling capabilities. CEO Widmar pointed out:
“This recycling process establishes a circular economy by recovering 90% of the semiconductor materials for reuse in First Solar’s models and 90% of the glass reuse in new glass container products.”
It’s vertically integrated manufacturing process provides end to end manufacturing transparency, cost savings and control of its responsible solar strategy. This can yield more wins as their thin-film PV modules have lower carbon footprints than crystalline silicone. CEO Widmar summed up First Solar’s foothold against China’s supply chain, “As the only alternative to crystalline silicon technology among the 10 largest solar module manufacturers globally, First Solar provides domestic supply security and enables the United States and global markets to reduce their over-reliance on imported panels from China.”

FSLR Opportunistic Pullback Levels
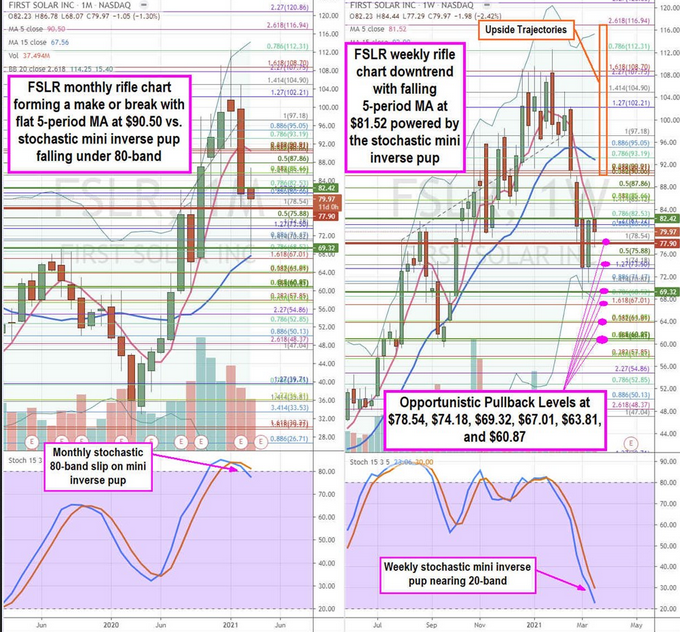
Using the rifle charts on monthly and weekly time frames provides a broader view of the landscape for FSLR stock. The monthly uptrend has stalled out after peaking and pulling back from the $112.31 Fibonacci (fib) level. The monthly 5-period moving average (MA) support is starting to slope down at $90.50 as the 15-period MA at $67.56 deflected sellers to trigger a weekly market structure low (MSL) buy trigger above $69.32 with a secondary weekly MSL trigger above $82.42. The monthly market structure high (MSH) sell trigger looms under $77.90. Be aware of this range. The weekly rifle chart is in a downtrend with a falling 5-period MA resistance at $81.52 aimed at the lower Bollinger Bands at $69.11. The weekly stochastic has a mini inverse pup nearing the oversold 20-band where it can coil or form a climax lean. This can produce opportunistic pullback levels at the $78.54 fib, $74.18 fib, $69.32 fib, $67.01 fib, $63.81 fib, and the $60.87 fib. Keep an eye on peers SPWR, JKS and SOL. The upside trajectories range from the $90.06 fib up towards the $116.94 fib.
