
Shares of First Horizon National Corporation (NYSE:FHN) have gained nearly 7% post second-quarter 2019 earnings release. The company reported adjusted earnings per share of 42 cents which surpassed the Zacks Consensus Estimate of 37 cents. Further, the bottom line was 17% higher than the year-ago figure.
Results reflect First Horizon’s top-line strength and lower expenses. In addition, efficiency ratio contracted during the quarter, indicating increased profitability. However, lower net interest income, rise in net charge-offs and provision for loan losses were the key undermining factors.
After considering certain non-recurring items, net income available to common shareholders came in at $109.3 million, up 34% than the prior-year quarter.
Segment wise, quarterly net income for the regional banking segment declined 3% year over year to $128.3 million. However, Fixed income and non-strategic segments reported net income of $12.2 million and $13.2 million, respectively, — an improvement from the year-ago quarter. The corporate segment incurred net loss of $40 million.
Revenues Climb, Costs Down
Total revenues for the second quarter came in at $461.6 million, up 5% on a year-over-year basis. Also, the top line surpassed the Zacks Consensus Estimate of $442.3 million.
Net interest income for the reported quarter dipped 2% year over year to $303.6 million. Net interest margin shrunk 19 basis points (bps) to 3.34%. However, non-interest income came in at $158 million, up 24%.
Non-interest expenses slipped 10% year over year to $300.4 million.
Efficiency ratio came in at 65.08% compared with 75.90% witnessed in the year-ago quarter. It should be noted that a fall in the efficiency ratio indicates increase in profitability.
Total period-end loans, net of unearned income, came in at $29.7 billion, up 6% from the previous quarter. However, total period-end deposits were $32.3 billion, down marginally from first-quarter 2019.
Credit Quality Worsens
Allowance for loan losses was up 4% year over year to $192.7 million. However, as a percentage of period-end loans on an annualized basis, allowance for loan losses was 0.65%, down 2 bps year over year.
Nonetheless, the quarter witnessed net charge-offs of $5.2 million compared with $1.7 million reported in the prior-year quarter. In addition, non-performing assets increased 44% to $225.7 million. Also, during the quarter, the company recorded $13 million in provision for loan losses against no provisions in the year-ago quarter.
Capital Position
Tier 1 common equity ratio was 9.25%, up from 8.98% at the end of the year-earlier quarter. Additionally, total capital ratio was 11.34%, up from 11.25%.
Our Viewpoint
Continued growth in loans will likely be conducive to First Horizon’s top-line performance. This apart, improvement in the efficiency ratio is anticipated to support its profitability. Nevertheless, rising provision for loan losses remains a drag.
First Horizon National Corporation Price, Consensus and EPS Surprise
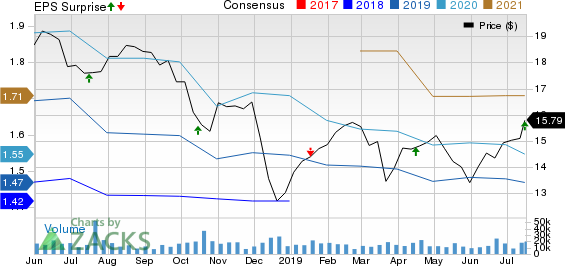
First Horizon National Corporation price-consensus-eps-surprise-chart | First Horizon National Corporation Quote
First Horizon currently carries a Zacks Rank #3 (Hold). You can see the complete list of today’s Zacks #1 Rank (Strong Buy) stocks here.
Performance of Other Banks
First Republic Bank’s (NYSE:C) second-quarter 2019 earnings per share of $1.24 lagged the Zacks Consensus Estimate of $1.26. Nevertheless, the bottom line improved 3.3% from the year-ago quarter.
Citigroup (NYSE:C) delivered a positive earnings surprise of 2.8% in second-quarter 2019, backed by expense control. Adjusted earnings per share of $1.83 for the quarter handily outpaced the Zacks Consensus Estimate of $1.78. Also, earnings climbed 12% year over year.
Modest loan growth and higher mortgage banking fees drove JPMorgan’s (NYSE:JPM) second-quarter 2019 adjusted earnings of $2.59 per share, which outpaced the Zacks Consensus Estimate of $2.50. Results exclude income tax benefits of $768 million or 23 cents per share. Including this, earnings were $2.82 per share.
Today's Best Stocks from Zacks
Would you like to see the updated picks from our best market-beating strategies? From 2017 through 2018, while the S&P 500 gained +15.8%, five of our screens returned +38.0%, +61.3%, +61.6%, +68.1%, and +98.3%.
This outperformance has not just been a recent phenomenon. From 2000 – 2018, while the S&P averaged +4.8% per year, our top strategies averaged up to +56.2% per year.
See their latest picks free >>
Citigroup Inc. (C): Free Stock Analysis Report
JPMorgan Chase & Co. (JPM): Free Stock Analysis Report
First Horizon National Corporation (FHN): Free Stock Analysis Report
First Republic Bank (FRC): Free Stock Analysis Report
Original post
Zacks Investment Research