Friday, the Conference Board released the latest batch of leading and coincident indicators. The LEIs had their second largest monthly increase in 7 months, rising .3%. 9 of 10 components rose. The coincident indicators rose the most in 7 months; all 4 components contributed. Most importantly, payroll employment and industrial production, which both contributed to May’s weak reading, strongly contributed to June’s rise, adding .11 and .09 respectively. Although this is only one month of data, these two figures point to a far stronger second quarter.
This past week saw the release of several housing market indicators, starting with Tuesday’s report on building permits and housing starts. Permits increased 1.5% M/M but were down 13.6% Y/Y and starts increased 4.8% M/M but declined 2% Y/Y. The following chart shows both data points have moved sideways for the last year:

Finally, existing home sales increased 1.1% M/M and 3% Y/Y, rising to a 9-year high. Overall, the housing market continues to provide very solid numbers, justifying the Fed’s confidence in this area of the economy:
Residential real estate activity continued to strengthen since the previous period. Single-family home sales increased at a moderate pace overall, with Boston, Cleveland, and St. Louis reporting strong growth. Many Districts indicated that inventories continue to be low. Despite this persistent inventory issue, Boston, Atlanta, Kansas City, and Dallas all report that contacts have a positive outlook for the market in the next few months. Districts generally reported that house prices increased. Residential construction activity was mostly positive across Districts. Cleveland and Kansas City indicated strong growth in housing starts. Conversely, New York reported that single-family construction tapered off through most of the District, and Chicago reported little change in residential construction activity. Philadelphia, Richmond, St. Louis, and San Francisco noted a lack of available lots to build on.
The NY Fed’s is predicting 2Q GDP of 2.2 while the Atlanta Fed is forecasting 2.4%.
Economic Conclusion: this past week’s releases were very positive. Housing, which has consistently contributed to growth over the last few years, continues to report solid results. The LEIs – which conveniently organize 10 key indicators – posted their second best results in 7 months. And thanks to large contributions from industrial production and employment, the coincident number was the strongest in 7 months. Overall, this was a very good week.
Market Overview: for the first time in the last 12-18 months, earning season is providing hope. From Zacks:
We now have Q2 results from 103 S&P 500 members that combined account for 25.8% of the index’s total market capitalization. Total earnings for these 103 index members are down -2.1% from the same period last year on +1.4% higher revenues, with 68.9% beating EPS estimates and 56.3% coming ahead of top-line expectations.
The blended, year-over-year sales decline for Q2 2016 is -0.3%, which is smaller than the estimated sales decline of -0.8% at the end of the quarter (June 30). Six sectors are reporting or are projected to report year-over-year growth in revenues, led by the Telecom Services and Health Care sectors. Four sectors are reporting a year-over-year decline in revenues, led by the Energy and Materials sectors.
Factset uses a slightly larger universe of reports, explaining their different numbers. But for the first time in at least a year, top line revenue is either declining by a very small amount or is increasing slightly. According to Factset, a majority of sectors are reporting Y/Y revenue growth.
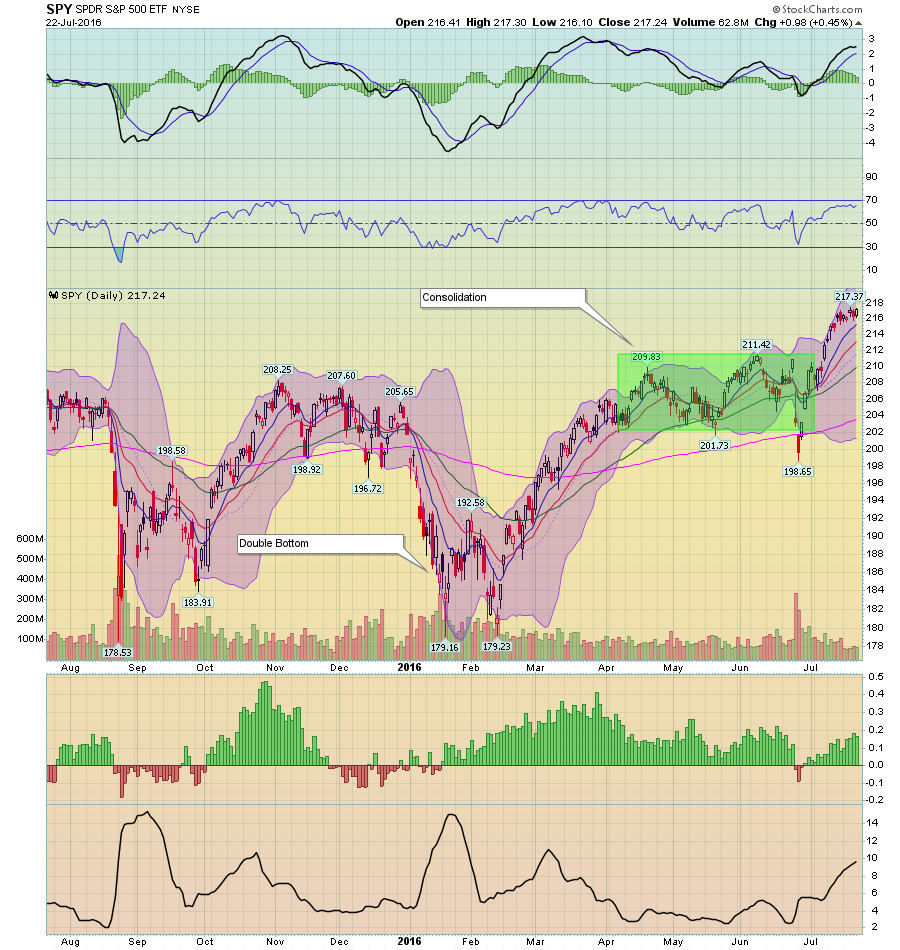
We’re still at the beginning of earnings season, so we definitely don’t want to draw any conclusions. But these are extremely positive developments, which justify this week’s S&P 500 rally (via SPDR S&P 500 (NYSE:SPY)):

The market formed a double bottom in February. Prices rallied from there and, in early April, began a two-month consolidation between 2011 and 2014. Recently, stronger earnings reports and a more lenient Fed have driven the market higher.
The only question left to answer is: will this rally continue? The jury is still out. On the negative side, the IWMs (small caps) and IJHs (mid-caps) have yet to make new highs and moved sideways the last few weeks. The Treasury market has rallied since January, indicating fixed income investors see little inflation, and therefore meaningful top-line growth. Finally, despite making new highs, last week’s sector performance was mostly defensive, with utilities, health care and technology strongly advancing; all other sectors either rose fractionally or declined.
But the earnings picture is finally improving. For the first time in 5 quarters, top-line revenue could actually increase from the previous quarter. At worst, it currently appears the pace of declines is waning, which alone should provide support for at least a slight increase in the market's overall level.
