
Fidelity National Information Services’ (NYSE:FIS) first-quarter 2019 adjusted earnings per share from continuing operations came in at $1.64, surpassing the Zacks Consensus Estimate of $1.57. Also, the bottom line improved 9.3% from the year-ago quarter figure of $1.50.
Organic revenue growth and expanding margin were the key tailwinds. However, huge outstanding debt posed a headwind. Also, poor performance of Global Financial Solutions segment was a key concern.
On a GAAP basis, the company reported net earnings attributable to common stockholders of $148 million or 45 cents in the quarter compared with $182 million or 54 cents in the prior-year quarter. In first-quarter 2018, the company’s results were impacted by dissolution of the Brazilian joint venture.
Organic Revenues Increase, Expenses Up
GAAP revenues for the quarter came in at $2.06 billion, which decreased slightly year over year. However, the figure surpassed the consensus estimate of $2.01 billion.
Organic revenue growth was nearly 5% in the quarter.
Selling, general and administrative expenses were $361 million, up nearly 1% year over year.
Segment wise, Integrated Financial Solutions’ GAAP revenues grew 6.4% to $1.13 billion while revenues from Global Financial Solutions declined 6.9% to $863 million. Corporate/Other revenues decreased 17.3% to $65 million.
Adjusted earnings before interest, tax, depreciation and amortization (EBITDA) rose nearly 3.4% year over year to $729 million while adjusted EBITDA margin expanded 130 basis points (bps) to 35.4%.
Balance Sheet & Cash Flow
As of Mar 31, 2019, cash and cash equivalents were $576 million compared with $703 million as of Dec 31, 2018. Debt outstanding was nearly $9.22 billion.
In the first quarter, net cash provided by operations was $294 million and free cash flow was $249 million.
Fidelity paid dividends worth $113 million in the quarter and repurchased 3.9 million shares at a total cost of about $400 million. As of Mar 31, 2019, the company had about $2.28 billion share repurchase authorization remaining.
Guidance for 2019
Fidelity expects organic revenue growth to be between 4% and 4.5% while GAAP revenues are expected to remain flat or increase 0.5%. This compares with previous guidance of 3.5-4.5% growth in organic revenues.
Adjusted earnings per share are expected to be in the band of $7.35-$7.55.
Adjusted EBITDA margin is expected to expand in the range of 150-200 bps.
Our Take
Fidelity enjoys a dominant position in financial and payments solutions business, backed by a robust product portfolio. We believe that the company is well positioned to benefit from increasing investment in digitization.
However, increasing consolidation in the banking sector, challenging environment for the Payments Solutions business and an uncertain regulatory environment are the primary headwinds.
Fidelity National Information Services, Inc. Price, Consensus and EPS Surprise
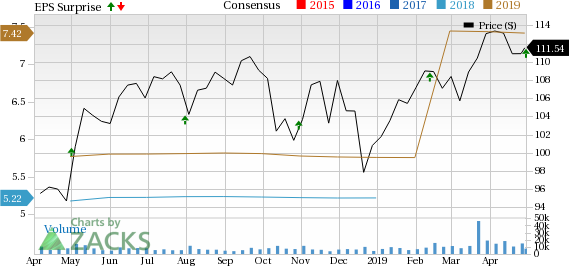
Fidelity National Information Services, Inc. Price, Consensus and EPS Surprise | Fidelity National Information Services, Inc. Quote
Fidelity currently has a Zacks Rank #4 (Sell).
You can see the complete list of today’s Zacks #1 Rank (Strong Buy) stocks here.
Performance of Other Stocks
Alliance Data Systems Corporation’s (NYSE:ADS) operating earnings of $3.55 per share for the first quarter of 2019 missed the Zacks Consensus Estimate of $3.76. The bottom line declined 13.4% year over year.
Visa Inc. (NYSE:V) reported second-quarter fiscal 2019 earnings of $1.31 per share, beating the Zacks Consensus Estimate by 5.65%. Also, the bottom line improved 18% year over year. The results were driven by growth in payments volume, cross-border volume and processed transactions.
Total System Services, Inc.’s (NYSE:TSS) first-quarter 2019 earnings per share of $1.15 surpassed the Zacks Consensus Estimate by 2.9% and also jumped nearly 4.5% year over year.Strong performance by all three segments — Issuer Solutions, Merchant Solutions and Consumer Solutions — contributed to the favorable results.
Is Your Investment Advisor Fumbling Your Financial Future?
See how you can more effectively safeguard your retirement with a new Special Report, “4 Warning Signs Your Investment Advisor Might Be Sabotaging Your Financial Future.”
Click to get it free >>
Total System Services, Inc. (TSS): Free Stock Analysis Report
Visa Inc. (V): Free Stock Analysis Report
Alliance Data Systems Corporation (ADS): Free Stock Analysis Report
Fidelity National Information Services, Inc. (FIS): Free Stock Analysis Report
Original post