
Federated Investors, Inc. (NYSE:FII) delivered a positive earnings surprise of 1.7% in fourth-quarter 2018. Earnings per share (EPS) of 61 cents surpassed the Zacks Consensus Estimate of 60 cents. However, the figure compares unfavorably with the prior-year quarter earnings of $1.31.
Higher revenues and improved assets under management (AUM) were the positives. However, elevated expenses were an undermining factor.
Net income for the reported quarter came in at $61.5 million compared with $131.8 million in the year-ago quarter.
For 2018, EPS of $2.18 surpassed the Zacks Consensus Estimate of $2.15. However, it declined from the year-ago figure of $2.87. Net income available to common stockholders (GAAP basis) was $220.3 million, down 24.4%.
Revenues Rise, Costs Escalate
Total revenues in the fourth quarter climbed 10% year over year to $307.2 million. Yet, the figure lagged the Zacks Consensus Estimate of $309.7 million.
Total revenues for 2018 were $1.14 billion, up 3% from the year-ago quarter. Further, it came in line with the Zacks Consensus Estimate.
The year-over-year upswing in revenues mainly stemmed from the consolidation of Hermes' revenues, partly countered by the adoption of new revenue-recognition accounting principle. Further, higher voluntary fee waivers for certain money market funds for competitive purposes and decline in revenues from lower average equity assets unfavorably impacted revenues.
Also, net investment advisory fees jumped 15% year over year to around $214 million. In addition, administrative service fees were up 6% to $52 million. However, net service fees (other) marked a 4% decline, amounting to $41.2 million.
During the quarter under review, Federated derived 36% of its revenues from money market assets, 63% from equity and fixed-income assets, and remaining 1% from sources other than managed assets.
Furthermore, due to net investment loss and higher debt expenses, the company recorded non-operating expenses of $6.2 million in the quarter, down 362% year over year.
Total operating expenses escalated 17% year over year to $219.3 million. The rise was primarily due to the consolidation of Hermes' expenses, partly offset decline in expenses on account of adoption of the new revenue-recognition accounting standard.
Steady Asset Position
As of Dec 31, 2018, total AUM was approximately $460 billion, up 16% year over year. Average managed assets were $443.7 billion, up 16%.
Federated witnessed equity assets of $72.5 billion, up 15% year over year. Also, money market mutual fund assets came in at $208.5 billion, up 12%.
Further, fixed-income assets declined 1.7% year over year to $63.1 billion. Additionally, money-market assets increased 13.8% to $301.8 billion.
As of Dec 31, 2018, cash and other investments were $190.5 million and total long-term debt totaled $135 million compared with $369.5 million and $170 million, respectively, as of Dec 31, 2017.
Capital Deployment Update
During the fourth quarter, the company repurchased 95,298 shares of Federated class B common stock for $2.2 million. With this, it repurchased a total of 1,205,790 shares for $29.1 million in 2018.
Our Viewpoint
Federated’s diverse asset and product mix, along with a solid liquidity position enabled the company to witness decent growth. Moreover, higher revenues are expected to boost its bottom-line performance, going forward. Nonetheless, higher expenses remain a concern.
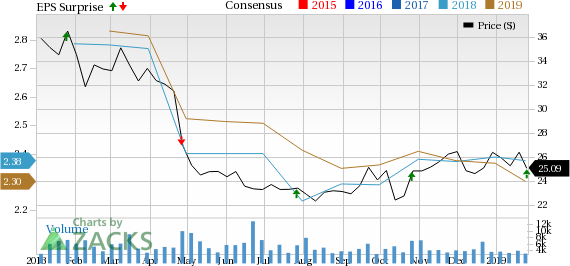
Federated Investors, Inc. Price, Consensus and EPS Surprise
Currently, Federated carries a Zacks Rank #3 (Hold). You can see the complete list of today’s Zacks #1 Rank (Strong Buy) stocks here.
Competitive Landscape
Cohen & Steers’ (NYSE:CNS) fourth-quarter 2018 adjusted earnings came in at 56 cents per share, missing the Zacks Consensus Estimate of 60 cents. However, the bottom line was 1.8% higher than the year-ago quarter.
BlackRock, Inc. (NYSE:BLK) posted fourth-quarter and full-year 2018 results. The company’s fourth-quarter adjusted earnings of $6.08 per share missed the Zacks Consensus Estimate of $6.39. Further, the figure came in 2% lower than the year-ago tally.
Ameriprise Financial, Inc. (NYSE:AMP) is slated to report results on Jan 30.
The Hottest Tech Mega-Trend of All
Last year, it generated $8 billion in global revenues. By 2020, it's predicted to blast through the roof to $47 billion. Famed investor Mark Cuban says it will produce "the world's first trillionaires," but that should still leave plenty of money for regular investors who make the right trades early.
See Zacks' 3 Best Stocks to Play This Trend >>
Federated Investors, Inc. (FII): Get Free Report
Cohen & Steers Inc (CNS): Free Stock Analysis Report
Ameriprise Financial, Inc. (AMP): Free Stock Analysis Report
BlackRock, Inc. (BLK): Get Free Report
Original post
Zacks Investment Research