
Federated Investors, Inc. (NYSE:FII) reported a negative earnings surprise of 5.3% in first-quarter 2019. Earnings per share of 54 cents lagged the Zacks Consensus Estimate of 57 cents. Moreover, the figure compares unfavorably with the prior-year quarter earnings of 60 cents.
Elevated expenses were on the downside. However, higher revenues and improved assets under management (AUM) were positives. Notably, completion of acquisition of Hermes Fund Managers Limited (Hermes), beginning Jul 1, 2018, positively drove the quarterly results.
Net income for the reported quarter came in at $54.5 million compared with $60.3 million witnessed in the year-ago quarter.
Uptrend in Revenues, Costs Escalate
Total revenues in the first quarter climbed 16% year over year to $307.1 million. However, the revenue figure slightly lagged the Zacks Consensus Estimate of $307.8 million.
The year-over-year upswing in revenues mainly stemmed from the consolidation of Hermes' revenues and higher average money market assets, partly muted by softer revenues from lower average equity and fixed-income assets.
Also, net investment advisory fees jumped 21% year over year to $211.2 million. In addition, administrative service fees were up 10% year over year to $54.1 million. Further, net service fees (other) marked a 3% surge, amounting to $41.7 million.
During the reported quarter, Federated derived 38% of its revenues from money-market assets, 61% from equity and fixed-income assets, and remaining 1% from sources other than managed assets.
Furthermore, due to rise in net investment income, partly offset by higher debt expenses, the company recorded non-operating income of $1.6 million in the quarter, compared with expense of $0.8 million witnessed in the prior-year quarter.
Total operating expenses escalated 28% year over year to $236.2 million. The rise was primarily due to the consolidation of Hermes' expenses.
Steady Asset Position
As of Mar 31, 2019, total AUM was a record $484.9 billion — up 24% year over year. Average managed assets were $475.4 billion, up 19% from the prior-year quarter.
Federated witnessed equity assets of $80.2 billion, up 36% year over year. Also, money market mutual fund assets came in at $214.8 billion, up 18% year over year.
Further, fixed-income assets grew 3% year over year to $64.1 billion. Additionally, money-market assets increased 20% year over year to $318.4 billion.
As of Mar 31, 2019, cash and other investments were $162.1 million and total long-term debt totaled $130 million, compared with $190.5 million and $135 million, respectively, as of Dec 31, 2018.
Capital Deployment Update
During the March-end quarter, the company repurchased 60,833 shares of Federated class B common stock, for $1.5 million.
Our Viewpoint
Federated displays substantial growth potential supported by its diverse asset and product mix, as well as a solid liquidity position. In addition, strategic acquisitions are anticipated to be favorable for the company. Though elevated expenses remain a concern, higher revenues could aid the company’s bottom-line performance, moving ahead.
Federated Investors, Inc. Price, Consensus and EPS Surprise
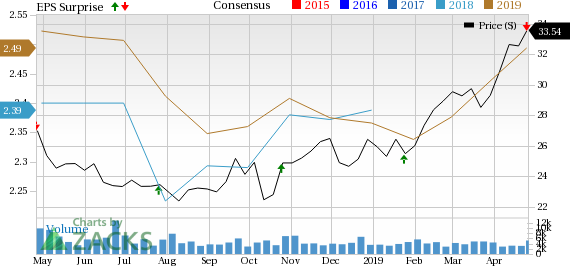
Federated Investors, Inc. Price, Consensus and EPS Surprise | Federated Investors, Inc. Quote
Currently, Federated carries a Zacks Rank #2 (Buy). You can see the complete list of today’s Zacks #1 Rank (Strong Buy) stocks here.
Competitive Landscape
T. Rowe Price Group, Inc. (NASDAQ:TROW) recorded a positive earnings surprise of 14.7% in the first quarter. Adjusted earnings per share came in at $1.87, outpacing the Zacks Consensus Estimate of $1.63. Results also improved 7.5% from the year-ago figure of $1.74.
Blackstone (NYSE:BX) reported first-quarter 2019 distributable earnings of 44 cents, lagging the Zacks Consensus Estimate of 52 cents. However, the figure reflects improvement from 41 cents earned in the prior-year quarter. Results reflected higher revenues and growth in AUM. However, higher expenses acted as a headwind.
BlackRock’s (NYSE:BLK) first-quarter adjusted earnings of $6.61 per share surpassed the Zacks Consensus Estimate of $6.20. Results benefited from a decline in expenses and higher AUM. Nonetheless, lower revenues acted as a headwind.
Zacks' Top 10 Stocks for 2019
In addition to the stocks discussed above, would you like to know about our 10 finest buy-and-holds for the year?
Who wouldn't? Our annual Top 10s have beaten the market with amazing regularity. In 2018, while the market dropped -5.2%, the portfolio scored well into double-digits overall with individual stocks rising as high as +61.5%. And from 2012-2017, while the market boomed +126.3, Zacks' Top 10s reached an even more sensational +181.9%.
See Latest Stocks Today >>
BlackRock, Inc. (BLK): Free Stock Analysis Report
T. Rowe Price Group, Inc. (TROW): Free Stock Analysis Report
The Blackstone Group L.P. (BX): Free Stock Analysis Report
Federated Investors, Inc. (FII): Free Stock Analysis Report
Original post
Zacks Investment Research