
The results of the Fed decision came in. No taper. But, the stock market sold off that day and so did gold. Why?
The answer may be found in the following article posted at CNBC where they state; “but markets interpreted language in the decision to mean that the end may come sooner than expected.” If markets and price action tell you what’s right at that moment, how can they be so wrong? It’s because they are fooled by what the Fed “says” and ignore what the Fed does.
This was also the conclusion of Citibank where they said they see the odds of a December/January taper doubling from 35% to 65%.
Listen to What I Say, Not What I do!
Here is what the Fed actually said;
“The Committee expects that, with appropriate policy accommodation, economic growth will pick up from its recent pace and the unemployment rate will gradually decline toward levels the Committee judges consistent with its dual mandate. The Committee sees the downside risks to the outlook for the economy and the labor market as having diminished, on net, since last fall. “
The latest data that has come out shows the following headlines which point to deflation and why the Fed won’t taper;
Oil Prices Keep Falling
U.S. wholesale prices decline in September
CPI Drops, Misses By Most In 14 Months
")
Let me put it to you straight. The Fed can’t taper any time soon. Look what happened last time when the market thought the Fed was going to taper. Interest rates shot up quickly and the stock market took a quick nose dive. But they can’t reveal this to everyone or people would lose faith in them, hence the “talk” earlier when Bernanke first got the media talking up the possibility of taper. Perhaps the stock market knows something that gold doesn’t as since the Fed announcement, stocks have moved higher and gold fell to new lows as of today. But even with the robust GDP report today, the stock market decided to take a breather as the DOW fell by more than 100 points. Talk about your confusion!
Is there a chance the Fed may do a token taper to make the market think they still have control of the situation? Sure. Especially if the stock market is out of control and interest rates are low enough. But it won’t be much at all. Probably like the $10 billion that the market thought the Fed would do last time they met. But I called their bluff correctly and said they wouldn’t taper just yet, because the interest rates were too high already.
In fact, I will take the other side of the coin however and say they will increase the amount of purchases of treasuries and mortgages in the future, more than likely beginning the second quarter of next year. The holiday’s are coming and our government doesn’t want us to start talking negative about things over the holiday, unless its gold of course.
My reasoning for more QE is confirmed today as the euro pean Central Bank President Draghi lowered rates. Why did he lower rates? To fight deflation! Does this sound familiar? Deflation, strong euro force ECB’s hand on rates
I have been in the stronger dollar , weaker euro camp for some time now. See Conversation with Axel Merk on Gold and euro at FreedomFest – Merk Funds. From July to today, Axel Merk was right, but part of the strength in the euro was the short term weakness in the dollar with Congress bickering over raising the Debt Ceiling and the potential of a default. I said that 80 on the dollar Index was the line in the sand I expected a bounce from and while the dollar did break below 80 for a bit, it never hit the 79 mark and now with the latest move by the ECB, is north of 80 again while the EUR/USD has fallen to the 133 range. 
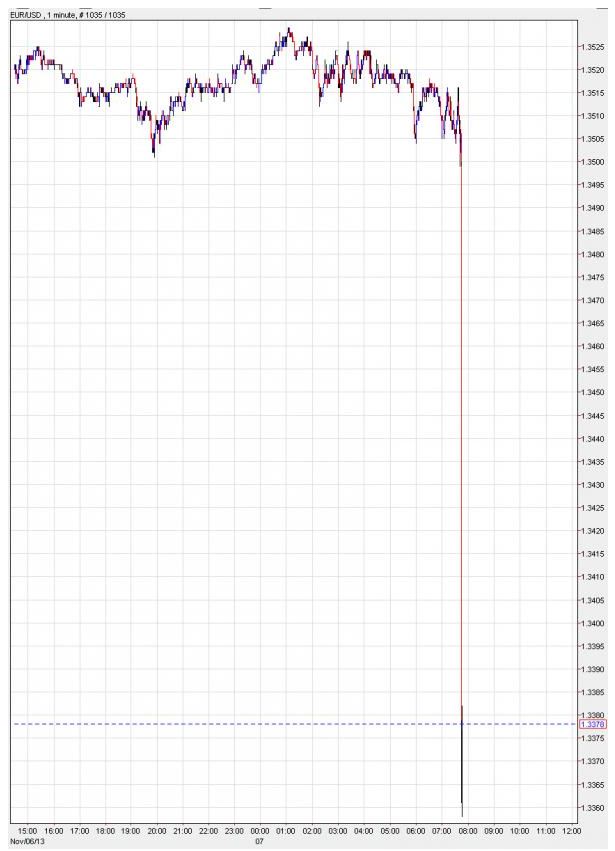 EUR/USD Chart" title="EUR/USD Chart" width="612" height="712">
We know nothing goes straight up or straight down, but I do expect the dollar to move higher, testing its 52 week high again. The weekly chart of the dollar Index shows the uptrend we have experienced since 2011. This has put pressure on the price of gold and silver and should continue to do so for the time being (bounces aside).

Should the dollar break 84 again, we may well test the 88 range again you see on the Monthly chart below. But naturally the Fed may speak up sooner.

But it’s not just about the euro , as the yen will also come into play. It is no secret that Japanese Prime Minister Shinzo Abe has been implementing what has become known as “Abenomics” in his attempt to bring about a weaker yen .
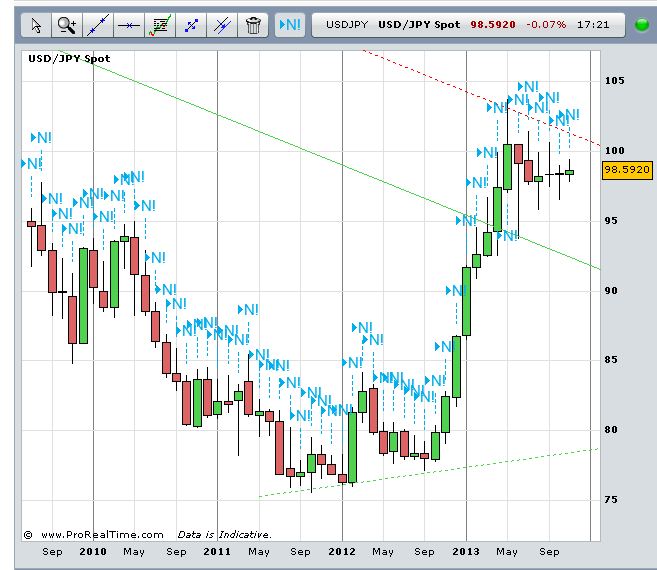 USD/JPY Spot Chart" title="USD/JPY Spot Chart" width="612" height="712">
You can see from the above chart where Shinzo’s policies of a weaker טen took effect as the dollar got stronger versus the yen . For now, the weaker yen is working to stimulate Japan’s economy. But not all countries can weaken their currencies all at once since they are priced in each other. It just so happens, Japan needed it the most and with the full blessing of the G20, proceeded with Abenomics. Now it’s the euro zone’s turn. Anyone notice a pattern here?
But alas, all good things must come to an end, and the dollar will be perceived to be the last bastion of safety. Actually, at some point, the dollar and Gold will be the beneficiary of this manipulation going on in euro pe and Japan which make up 70% of the dollar Index. It’s not that the U.S. Fed isn’t doing the same thing as the other Central Banks; I don’t discount that at all. It’s just that the U.S. doesn’t have the Southern countries of Spain, Italy, Portugal, Greece and Northern country of Ireland to contend with (although Ireland has come around some, they are still over 100 Debt to GDP ratio. As far as Japan (yen ) compared to the U.S. goes, we don’t have a 250% Debt to GDP to deal with (at least not yet). So there is more room to run with future QE from the Fed if necessary. Another point about the U.S. Debt to GDP ratio number is we have changed the way we calculate GDP. Peter Schiff has a good explanation of it here. Today’s GDP numbers came in better than expected. Could this be because of the new way they calculate? Possibly, but most of today’s number was the inventory sitting on the shelves; not a real sign of productivity.
I still see the end of year tax loss selling coming which can trigger a possible test of the lows for gold, despite any future QE that is sure to come. I just don’t see the QE till next year though. Right now, a higher stock market is putting pressure on some of the holders of gold as they chase the latest fad. I do expect this to continue over the short term. We gold investors have to be patient because of what’s to come which I’ll talk some about next.
Debt to GDP Ratio Comparisons – Past, Present and Projected
If one is to be attracted to gold, then they need to understand how much debt their country owes compared to how much it produces. If debt is rising and there is no growth that has the potential of offsetting some of that debt, then there is a higher risk of default. That’s why we look at each countries Debt to GDP Ratio for clues. Keep in mind, the projections below in my opinion don’t come close to addressing unfunded liabilities (cost of the growth of government and entitlement programs and in the U.S. case, and unknown called Obamacare).
The following is from Standard & Poor’s outlook among advanced economies and emerging economies, as well each nation’s Debt-to-GDP ratio from 2011 and projections of 2013. I then do a side by side comparison of the S&P’s projections with each countries actual result as of today. It should be noted that Ireland, the only country that practiced real austerity, actually took the pain and did reduce their Debt to GDP ratio. It should also be noted that only Ireland and Japan’s 2016 projections were lower than 2012 actual debt to GDP ratios. Japan’s Prime Minister Shinzo, as noted above, has made up for that and Ireland as of Mid-October 2013 has decided to ease back on austerity. 
In my next book, “Illusions of Wealth,” I will be pointing out how past projections from S&P, CBO, and other government offices have not come close to reality today which implies that today’s projections should be taken with a grain of salt. The same groups that didn’t see the 2008 financial crisis coming, including the Federal Reserve and Central Banks of the world, as well as most government agency offices, cannot possibly see what lies ahead. This list also includes the leading economists of the world (the one’s all the governments turn to for projections). Perhaps it’s because their economic philosophy is wrong?
All Central Banks will eventually do what the Fed, Shinzo, and now Draghi are doing to try and stimulate their own economies.
Up next: the Fed. That’s why any talk of taper is premature.