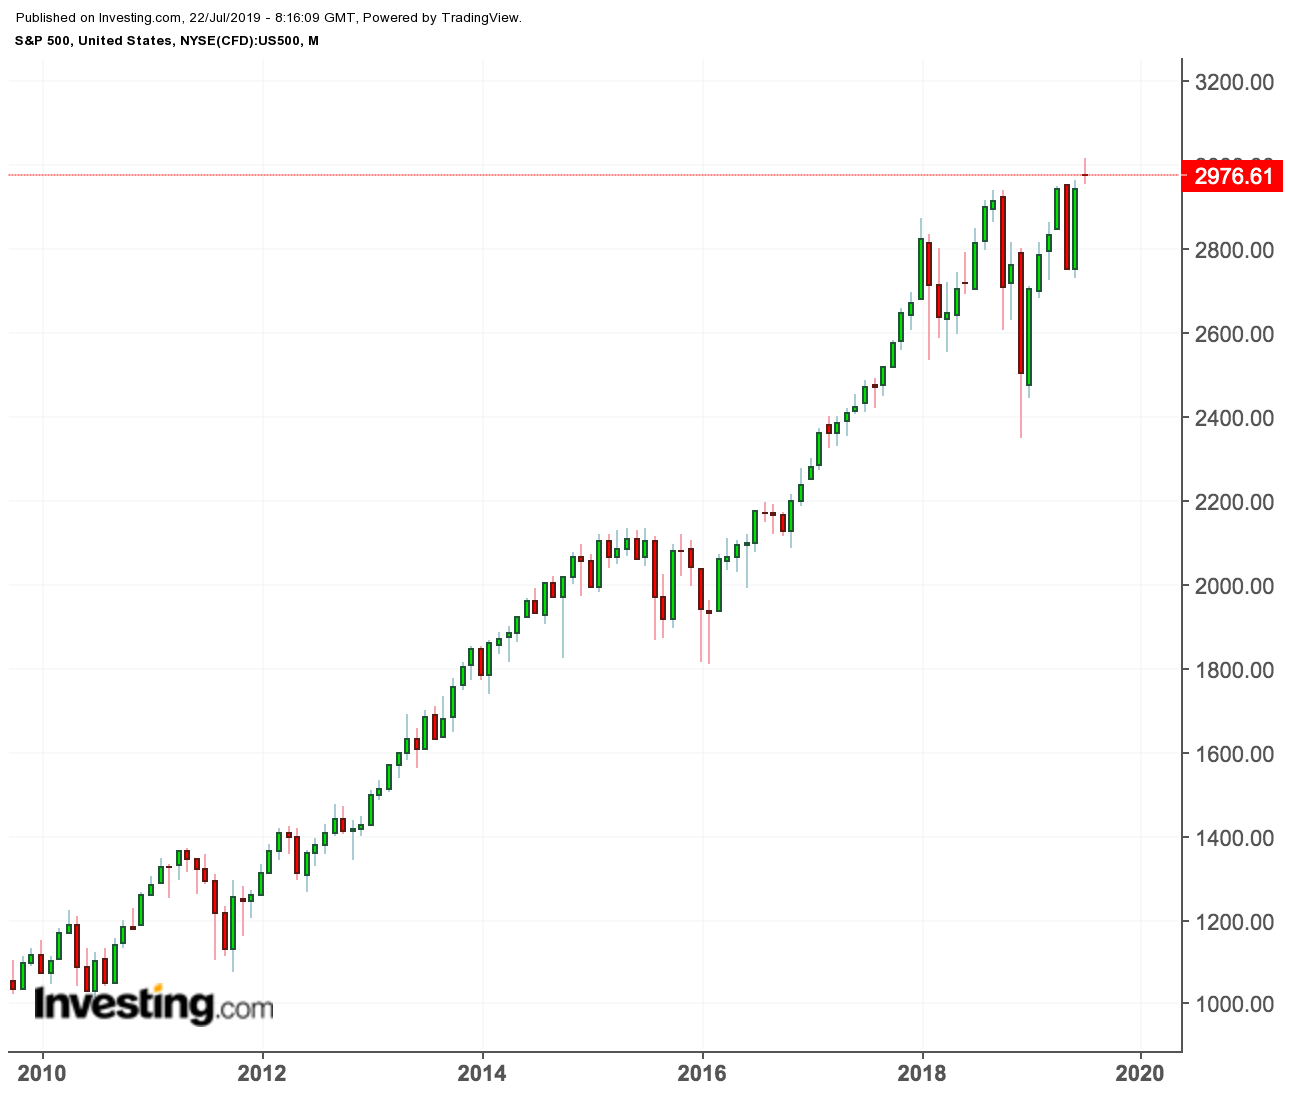
Since the financial crisis of 2008, when the S&P 500 infamously bottomed at 666, the index has climbed around a whopping 340%, to the new all-time highs we are seeing today.
When a bull market lasts this long, it's only natural for investors to wonder if the end is near for this cycle. One way to stay alert for red flags is by looking back at past events. History often repeats itself: knowing why previous bull markets ended can help us identify potential problems ahead of time.

In previous downturns, tighter monetary policy, tighter fiscal policies, geopolitical turmoil and an overvalued stock market have been to blame. It's worth taking a look at what happened then to try to predict what may happen now.
Tighter Monetary Policies
Tighter monetary policies that brought forth recessions are truly a recurring theme when examining previous ends of bull markets. Tighter monetary conditions can limit the economy’s growth potential and cool down an economic expansion to the point of reversing it altogether.
Tighter monetary conditions preceded the end of bull markets in 1937, 1956, 1966, 1968, 1980, and 1990. In 1980, Paul Volcker, then Fed chair, raised the fed funds rate to 20%, its highest level in history, in order to reign back inflation that was running at 13% -14%. While Volcker managed to control inflation bringing it back to a "more appropriate" 7% level a year later, his action led the U.S. to a recession in 1981, and the S&P 500 fell 27% in 1980-1982. Another example is a mistimed monetary tightening that occurred in 1966 when William McChesney Martin was Fed chair. This led to a credit crunch, which in turn contributed to a 22% drop in the S&P in 1966.
Tighter Fiscal Policies
A major cause for concern during the 20th century, in the market’s earlier years, was the cutting back of government spending in 1937 and 1946. This brought forth market drops of 60% and 30%, respectively. This explanation for economic underperformance comes from Keynesian Economics, which were first popularized during the Great Depression. In Keynesian economics, government investment in infrastructure was a solution to the great depression which began in 1929. Indeed, the U.S. government slashing spending in 1937 and 1946 was a major reason for the stock market downturns that occurred in those years.
Geopolitical Turmoil and Oil Prices
While geopolitical turmoil and oil prices may not have single-handedly killed bull markets, they have played a part in stalling the markets a few times over the past decades. On three different occasions, geopolitical tensions and oil prices peaked at just the wrong moment. In 1973, OAPEC decided to issue an oil embargo. The U.S. was already treading on dangerous grounds with the abandonment of Bretton Woods (meaning dollars weren't convertible to gold as they previously were), which created rampant inflation, and a sudden 39% jump in the price of oil contributed to the end of the bull market. The same can be said about sudden oil price jumps following the 1979 oil crisis and the 1990 Iraqi invasion of Kuwait.
Overvaluations
Sometimes stock prices just rise, soaring out of touch with reality, and need to come back down. Overvaluations were the primary reasons for the end of bull markets in 1961 and 2000, and contributed in 1946 and 1987. Those four years are four of the five instances between 1946 and 2000 where the S&P 500 PE ratio was above 20 – a threshold historically considered expensive.
The dot-com bubble is perhaps the most striking example of a case where investors were swept up in the mania to buy stocks at any price. In 2000, as the internet rose to prominence, a buying frenzy led to unsustainable valuations. Companies such as the infamous Pets.com raised tens of millions of dollars only to vanish shortly thereafter when it became clear that they had no viable business model nor any path to sustainable revenue.
And while not stocks related, the housing bubble of 2007 belongs here as well. The collapse of the housing bubble triggered a nationwide financial crisis and a two-year recession, leading to a drop of 57% in the S&P between October 2007 and March 2009.
Conclusion
Back to 2019, this bull market has been running for over ten years now, and ‘when will it end’ is a very legitimate question. There’s always the possibility of a black swan type event that no one will see coming, but as interest rates seem to be on their way down, rather than up, it’s less of an immediate concern.
Fiscally, the U.S. government has consistently spent around $100 billion on infrastructure every year, and there is no reason to believe government spending will slow anytime soon. Geopolitical tensions and oil are a concern, with China, North Korea and Iran being potential conflict points.
From a valuation standpoint, the market isn’t cheap right now. The S&P 500 has a P/E ratio of 22, higher than its mean historical value of 15.75. The total market cap of the stock market to the U.S. GDP ratio is at 143%, very close to its all-time high of 148%, reached during the dot-com bubble.
So where do we go now? The market can often tolerate high valuations that may even seem unreasonable for quite some time, and geopolitically, we are still far from a war or invasion scenario. Looking at historical reasons for why bull markets end, it seems that as long as the Fed caters to the market, we’ll be fine. Once it stops though, there is definitely a risk that the relatively high valuations that we accept now will lead to more than a simple 20% correction.
