
The PBOC stepped in to soothe the market's mayhem seen, with stocks rebounding hard even if bond traders are not buying into it by keeping long-dated US paper under extreme downside pressure, which implies that the outlook for the US/global economy keeps deteriorating.
Quick Take
The PBOC finally acted as the circuit breaker to ameliorate financial conditions by setting a firmer yuan fixing and looking to conduct bond operations to soak up offshore yuan liquidity via a series of bond issuances in Hong Kong. It did make the trick to soothe the market's mayhem seen, with stocks rebounding hard even if bond traders are not buying into it by keeping the long-dated US paper under extreme downside pressure, which implies that the outlook for the US/global economy keeps deteriorating. That's been reflected in another fully priced-in rate cut of 25bp by the Fed in Sept, with chances of a 50bp cut ranging from 15% today to as high as 50% at one stage yesterday. The rampant demand for Gold is yet another sign that the current setting remains ugly to see a sustainable recovery in risk trades. As we head into Wednesday, the USD has managed to contain its moderate fall, while the Canadian dollar comes under the siege of sellers under intense pressure just as Oil keeps falling to new lows. The market's favorite long plays (JPY, CHF) finally found a meaningful phase of profit-taking as risk appetite made a temporary appearance although dip buyers are lurking around. The Euro remains supported from the unwinding of risk positions as EUR-funded carry trades get closed. The Sterling is drawing more interest from buyers too, as is the AUD despite a slightly more dovish RBA. Lastly, the NZD was smashed after the RBNZ went out of its way to cut the benchmark rate by 50bp to 1% and match Australia's rate-setting level.
Narratives In Financial Markets
* The Information is gathered after scanning top publications including the FT, WSJ, Reuters, Bloomberg, ForexLive, Institutional Bank Research reports.
Risk on the mend as PBOC stabilizes the yuan: The market has taken a bit of a breather with risk assets back on the green after the PBOC stepped in to facilitate a relaxation of the selling pressure in the Chinese yuan by setting a firmer-than-expected fixing, while it also announced it plans to conduct a bond sale of 30 billion yuan ($4.25 billion) worth of yuan-denominated bills in the Hong Kong offshore market to improve liquidity and prevent speculative short-selling. USD/CNH ends the day circa 7.05.
PBOC aims to project reassurance at home: Reports have emerged of a meeting between the PBOC and foreign exporters in Beijing to reassure that the yuan’s weakness will not continue in such a rapid manner, which is congruent with the actions we’ve seen by the PBOC to stabilize the yuan exchange rate. The PBOC is obviously worried that the sharp yuan depreciation may lead to capital outflows, so they need to strike a message of credibility and reassurance to manage the uncertain environment.
PBOC keeps talking its own agenda: The PBOC has made a statement by which it opposes US' accusations of being a currency manipulator, noting that the unfair claim is related to unilateralism and protectionism, adding that the yuan exchange rate is decided by market supply and demand. They also reiterated that they will not use the yuan as a tool to deal with trade disputes. The actions from this week, however, imply that China is looking to take a new approach in the Yuan by letting it be more market-determined, with the break and close above the 7.00 last Monday the proof in the pudding, which has been read by the market as a measure to offset the US tariffs.
China yet to rule out further trade talks: If the US and China have genuine intentions to disentangle this new phase of provocations by both sides, the negotiations must resume rapidly or else it may create further negative spillover effects in China, the US and globally, with especially tough repercussions in Asia. The latest episode of a yuan-induced risk aversion in the markets must still be read in the context of upcoming US-China trade talks next month with neither side having canceled talks. At least, China is yet to rule out the next round of negotiation due in September. Besides, US economic advisor Kudlow said on Tuesday the US is still expecting talks with China in September.
Trump is playing with fire: The Washington Post notes “Trump thinks that continuing to punish China will spur Beijing to negotiate. But some aides fear that his hard-line stance will backfire” and that “aides have brought Trump charts to convince him that the currency charge is untrue, but the president remains firm in his beliefs”.
RBA sticks to dovish script but patience warranted: The RBA monetary policy was left unchanged, with the rate at a record low of 1%, while keeping a dovish bias in its statement, which is a position expected to remain for a prolonged period of time, as per the latest public comments made by the RBA Governor Lowe. In the August statement, this was reflected via the following passage "It is reasonable to expect that an extended period of low-interest rates will be required in Australia to make progress in reducing unemployment and achieve more assured progress towards the inflation target. On the latter, a separate more pessimistic view was also issued by noting that while “the central scenario remains for inflation to increase gradually, it is likely to take longer than earlier expected for inflation to return to 2 percent.”
The RBNZ takes bold action by slashing the rate 50bp: Ahead of the event, the market had fully priced a cut. However, given the strong labour market figures yesterday (unemployment rate fell to 3.9% vs 4.3% expected), it had somehow troubled the market as to how aggressive the RBNZ would be as the global outlook softens. The decision left the market in perplexity, as the Central Bank decided to cut its rate by more-than-expected (50bp), sending a clear message that, as the backdrop stands, the domestic tailwinds in the labor data won't prevent the Central Bank from conducting an aggressive adjustment to ensure the easing of financial conditions. What made this outcome ultra dovish for the NZD was the fact that the decision reached by the Board was unanimous. The RBNZ states that "our actions today demonstrate our ongoing commitment to ensure inflation increases to the mid-point of the target range, and employment remains around its maximum sustainable level."
Fed's Bullard not as dovish in rates: Fed's Bullard continues to walk back its perma dovish stance by flipping his view to now think that the FOMC should not react to "tit-for-tat trade war", adding that US interest rates are "in the right neighborhood", while watching data to further shape his opinion. These comments by Bullard, who happens to be the most vocal dovish among Fed officials, is dollar-positive, which alongside the risk rebound, has placed the odds for a 50bp rate cut in Sept to just 18% vs 50%.
Recent Economic Indicators & Events Ahead
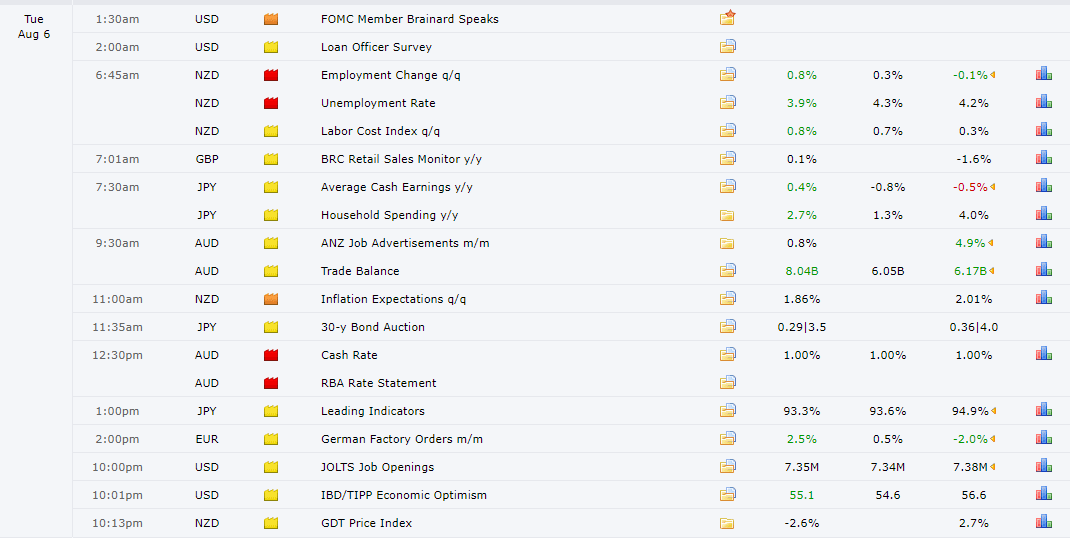

Source: Forexfactory
A Dive Into The Charts
My hat goes off to those holding such a challenging long trade as is the EUR, one that while it sounds counterintuitive to endorse based on the ECB’s ultra-dovish stance, yet it has benefited from the unwinding of risk positions as EUR-funded carry trades get closed. The Pound, this time, played catch up with the Euro’s bullish bias, by putting on a similar performance. Meanwhile, the USD index (equally-weighted against G8 FX) has found expected pockets of demand as a key level of support was tested. The Canadian dollar looks like one of the weakest currencies heading into Wednesday as the close in the index indicates, with a high volume sell-side candle breaking through a key level of support. Not the time to be bullish on the Canadian dollar this Wednesday judging by the sentiment obtained through the index. We’ve also witnessed a rejection of the 100% proj target in the yen index, even if the long lower tail in the daily suggests the interest to buy the dips in the preferred ‘risk-off’ currency remains substantial. An identical pattern applies in the Swissy index chart. The Australian dollar has managed to duck relatively successfully the RBA bullets, as the Central Bank left its policy unchanged even if maintaining a clear dovish path. There is definitely stronger interest to be buyers of the Aussie around these depressed levels, especially if the Chinese keep their word in facilitating the conditions to stabilize the yuan. Lastly, the NZD has found demand where one would have expected it to emerge from, that is, a key level of support.
The first chart to outline is the pair that has become the center of the financial universe to set the tone in the currency market for the day. On Tuesday, I did highlight that the rapid weakness in the Chinese yuan, which had reached its 100% proj target, was always going to be the precursor that would activate the PBOC alarm bells to act in some manner to stabilize the rate. Through the issuance of Chinese bonds to mop up liquidity offshore and discourage short-selling, alongside the firmer yuan fixing, this scenario played out, which is what set the ball rolling for the improvement in risk appetite, even if still a drop in an ocean of weekly reds.
Next, I’d like to bring to the readers’ attention the rebounds seen off the 100% projection levels in a handful of Aussie pairs as we headed into the RBA policy decision. AUD/CHF, AUD/USD or AUD/JPY could have been long trades to consider upon one’s own strategy, knowing that these are reactionary areas where prices tends to find a blockage by the cluster of orders, causing an absorption of offers in this case, which leads to an initial rebound one can capitalize on.
But there were other 100% proj-derived long propositions one could have considered as the risk curve in financial markets ameliorated. Those cunningly in the wings to inspect long plays in pairs such as USD/JPY or EUR/CHF were certainly rewarded. Again, you can’t make this stuff up. The reversals, as is often the case, occurred right at the projected target, which once again, validates the virtue of those that pay close attention to market symmetries to follow the flows.
A chart that strikes me by the price action formed on Tuesday is the CAD/CHF, printing the type of bearish bar that one wants to see to keep its short bias intact. Not only we’ve seen the resolution of price by closing below a key support, but the candle carries an increase in the commitment of sellers as reflected by the tick volume spike seen. This is a price action-based candle pattern reminiscent to the setup that led to a major selloff in the S&P 500 this week.
Part of the reason the CAD has come under sellers’ siege to surround further ground has to do with the impulsive sell-off seen in Oil. Readers of my daily edge know that I’ve been endorsing the solid likelihood of Oil finding further supply imbalance on the basis of its clear bearish market structure, with price action, volume and fundamentals aiding the negative view.
Another commodity that remains steady on its quest to reach its next milestone is gold, which after printing a notoriously sizeable bullish outside day, has displayed a similar long play by experiencing rampant demand en-route to its next target around the 1,500.00 level.
Important Footnotes
- Risk model: The fact that financial markets have become so intertwined and dynamic makes it essential to stay constantly in tune with market conditions and adapt to new environments. This prop model will assist you to gauge the context that you are trading so that you can significantly reduce the downside risks. To understand the principles applied in the assessment of this model, refer to the tutorial How to Unpack Risk Sentiment Profiles
- Cycles: Markets evolve in cycles followed by a period of distribution and/or accumulation. To understand the principles applied in the assessment of cycles, refer to the tutorial How To Read Market Structures In Forex
- POC: It refers to the point of control. It represents the areas of most interest by trading volume and should act as walls of bids/offers that may result in price reversals. The volume profile analysis tracks trading activity over a specified time period at specified price levels. The study reveals the constant evolution of the market auction process. If you wish to find out more about the importance of the POC, refer to the tutorial How to Read Volume Profile Structures
- Tick Volume: Price updates activity provides great insights into the actual buy or sell-side commitment to be engaged into a specific directional movement. Studies validate that price updates (tick volume) are highly correlated to actual traded volume, with the correlation being very high, when looking at hourly data. If you wish to find out more about the importance tick volume, refer to the tutorial on Why Is Tick Volume Important To Monitor?
- Horizontal Support/Resistance: Unlike levels of dynamic support or resistance or more subjective measurements such as fibonacci retracements, pivot points, trendlines, or other forms of reactive areas, the horizontal lines of support and resistance are universal concepts used by the majority of market participants. It, therefore, makes the areas the most widely followed and relevant to monitor. The Ultimate Guide To Identify Areas Of High Interest In Any Market
- Trendlines: Besides the horizontal lines, trendlines are helpful as a visual representation of the trend. The trendlines are drawn respecting a series of rules that determine the validation of a new cycle being created. Therefore, these trendline drawn in the chart hinge to a certain interpretation of market structures.
- Correlations: Each forex pair has a series of highly correlated assets to assess valuations. This type of study is called inter-market analysis and it involves scoping out anomalies in the ever-evolving global interconnectivity between equities, bonds, currencies, and commodities. If you would like to understand more about this concept, refer to the tutorial How Divergence In Correlated Assets Can Help You Add An Edge.
- Fundamentals: It’s important to highlight that the daily market outlook provided in this report is subject to the impact of the fundamental news. Any unexpected news may cause the price to behave erratically in the short term.
- Projection Targets: The usefulness of the 100% projection resides in the symmetry and harmonic relationships of market cycles. By drawing a 100% projection, you can anticipate the area in the chart where some type of pause and potential reversals in price is likely to occur, due to 1. The side in control of the cycle takes profits 2. Counter-trend positions are added by contrarian players 3. These are price points where limit orders are set by market-makers. You can find out more by reading the tutorial on The Magical 100% Fibonacci Projection