- All Instrument Types
- Indices
- Equities
- ETFs
- Funds
- Commodities
- Currencies
- Crypto
- Bonds
- Certificates
Please try another search

Explaining The “Robot” ETF’s Bull Run With Factor Analysis

Bloomberg last week published an intriguing story about a new exchange traded fund (ETF) that uses artificial intelligence (AI) to outperform market indexes and active managers alike. The implication: a new era of AI-driven investing has dawned, putting the standard applications of indexing at a disadvantage. Yet a closer look at the so-called Robot ETF’s results via a factor-analysis lens tells a different story and one that can be explained with a mix of large-cap, small-cap and micro-cap equity betas. In turn, replicating the Robot ETF’s performance, which Bloomberg claims “leaves pros in the dust,” is a simple matter of holding a trio of plain-vanilla index funds.
To be fair, the Bloomberg article notes that the AI Powered Equity (AIEQ) has a healthy dose of small-cap bias. But we’re also told that the ETF uses IBM’s Watson platform, an AI system that’s deployed 24/7 to analyze “more than 6,000 US public companies each day before picking about 100 of them to own.” Impressive, but running a factor analysis on the fund suggests there’s an easier and more accessible methodology for achieving the same performance – with modestly lower risk.
As a test, let’s assume that the AIEQ’s returns can be largely explained by three equity betas, as proxied by a trio of the following conventional US stock ETFs:
- SPDR S&P 500 (NYSE:SPY): a proxy for large-cap stocks
- iShares Core S&P Small-Cap (IJR): a proxy for small-cap stocks
- iShares Russell 2000 IWM: a proxy for micro-cap stocks
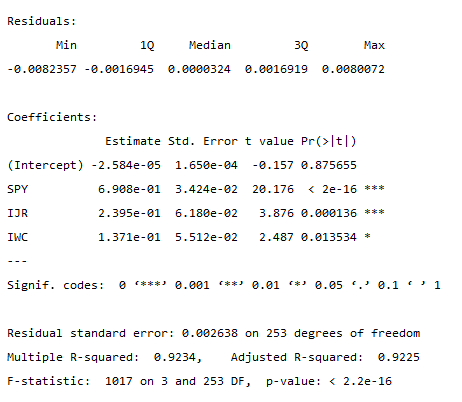
The daily returns for all the ETFs are reduced by the risk-free rate, proxied by iShares Short Treasury Bond (NASDAQ:SHV), to generate risk premia. One caveat: AIEQ was launched about a year ago and so the historical results are limited. But let’s ignore that drawback and see how the data stacks up by running a multiple regression on AIEQ against the three ETFs. Here are the results:

The main takeaway: large-cap equity beta (SPY) explains most of AIEQ’s returns, with smaller but still statistically significant readings for small cap (IJR) and micro cap (IWC). Overall, the three ETFs in aggregate explain nearly all of AIEQ’s performance via a multiple R-squared reading of 0.92.
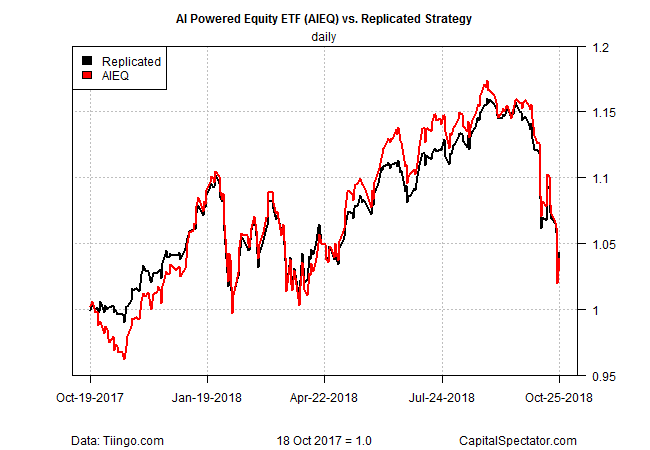
The analysis above suggests that we can closely replicate AIEQ with the three index ETFs. A formal replication project would employ reverse engineering the risk and return profile via a quantitative engine, as explained here. But as a quick test let’s guesstimate the weights for replication with a 60% weight in SPY, 30% in IJR and 10% in IWC. As the performance chart below shows, the replicated strategy tracks AIEQ closely.

As a bonus, the replicated strategy earned a slightly higher return vs. AIEQ – roughly a 4.4% annualized performance for the period in the chart above vs. AIEQ’s 3.6%. Even better, the replicated strategy’s risk (annualized volatility of daily return) was slightly lower: 13.6 vs. 15.1 for AIEQ.
Keep in mind, too, that AIEQ’s expense ratio is relatively pricey: 0.75%, according to Morningstar. SPY and IJR each charge less than 0.10% and while IWC’s is higher at 0.60%, the weighted expense ratio for the replicated strategy is still roughly 0.14%, well below AIEQ’s price tag.
Are these results surprising? Not really. A deep pool of empirical and academic research tells us that most, perhaps all active strategies can be replicated via factor analysis and low-cost index funds.
As for AI, there are surely many applications that this technology will disrupt and usher in improvements over the existing methodologies. But for the moment, it’s premature to argue that AIEQ’s secret sauce of AI is a game changer for investing vs. the standard approach via factor analysis and indexing.
Related Articles

If there was a "Stock of the Year" award, it would certainly go to Nvidia (NASDAQ:NVDA). As a result of the continued AI boom, the market cap of this semiconductor manufacturer...

A data provider tracks the stocks trades of members of Congress An asset management firm created two ETFs tracking how Congress members invest The Democratic and...

Below we can see how the top stocks in the S&P 500, as tracked by the Invesco S&P 500® Top 50 ETF (NYSE:XLG), have gained 22.5% in 2024. That easily beats the SPDR®...
Are you sure you want to block %USER_NAME%?
By doing so, you and %USER_NAME% will not be able to see any of each other's Investing.com's posts.
%USER_NAME% was successfully added to your Block List
Since you’ve just unblocked this person, you must wait 48 hours before renewing the block.
I feel that this comment is:
Thank You!
Your report has been sent to our moderators for review


Add a Comment
We encourage you to use comments to engage with other users, share your perspective and ask questions of authors and each other. However, in order to maintain the high level of discourse we’ve all come to value and expect, please keep the following criteria in mind:
Enrich the conversation, don’t trash it.
Stay focused and on track. Only post material that’s relevant to the topic being discussed.
Be respectful. Even negative opinions can be framed positively and diplomatically. Avoid profanity, slander or personal attacks directed at an author or another user. Racism, sexism and other forms of discrimination will not be tolerated.
Perpetrators of spam or abuse will be deleted from the site and prohibited from future registration at Investing.com’s discretion.