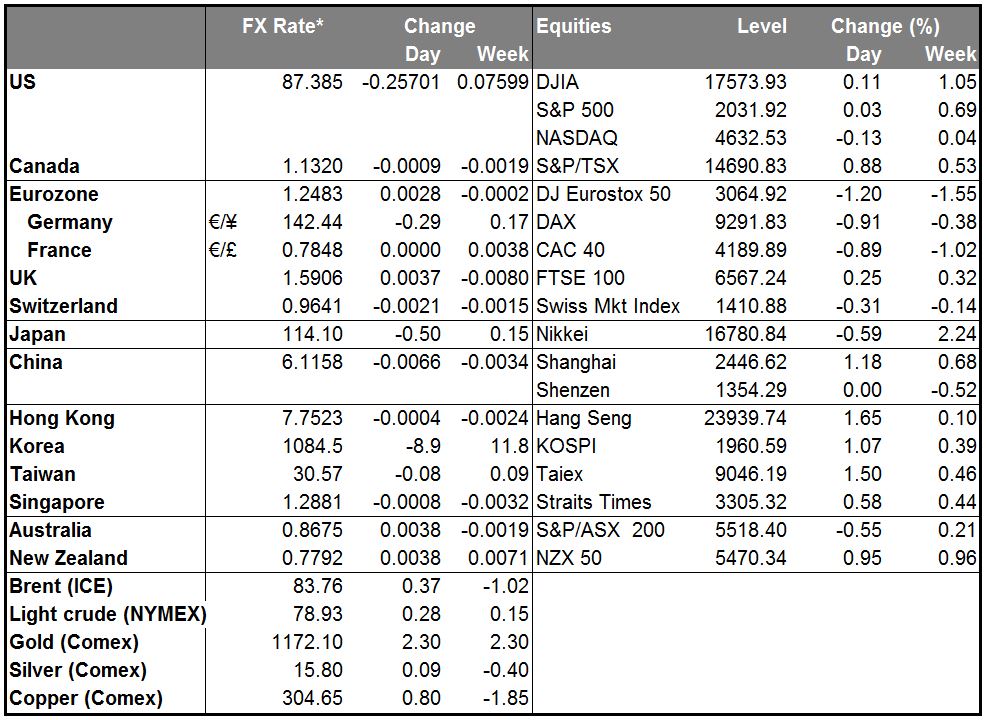
“A solid labour market backed up the Federal Reserve’s decision to halt its QE3 round of asset purchases this month” and confirmed that the economy is expanding at a rate “that may yet force the Fed to raise interest rates as early as next spring,” opined the FT. Market News International agreed that the Fed “got another green light to raise interest rates.”
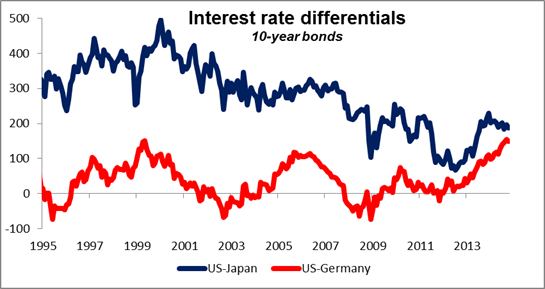
So why did Fed funds rate expectations collapse 9 bps in the long end, U.S. 10-Year yields plunge 10 bps, and the dollar fall against every currency we track except the beleaguered RUB? Initially, investors were unsure about whether the weaker-than-expected gain in payrolls or the unexpected drop in the unemployment rate was more significant. In the final analysis, positioning and international developments may have been more important than the outlook for US rates. In the bond market, real money investors apparently went into the report underinvested and speculative accounts were short, and after rates failed to rise, capitulation trades sent yields sharply lower. The downward pull of falling Bund and JGB yields probably influenced investors as much as the sluggish gain in average earnings as the spreads of Treasuries against those markets has widened out considerably recently. (The Treasury-Bund spread is the widest since June 1999.) The dovish repricing of the Fed funds futures remains more of a mystery to me. The fact that average earnings growth isn’t accelerating is not the same as earnings growth slowing and hence should not warrant such large downward shift in expectations, in my view. I believe this shift is likely to be reversed in coming days and the dollar resume its uptrend.
Catalonia held its straw vote on independence Sunday and an overwhelming 81% of the voters approved of independence. While the vote is non-binding – indeed, it’s illegal – it just adds one more bit of uncertainty to the EUR.
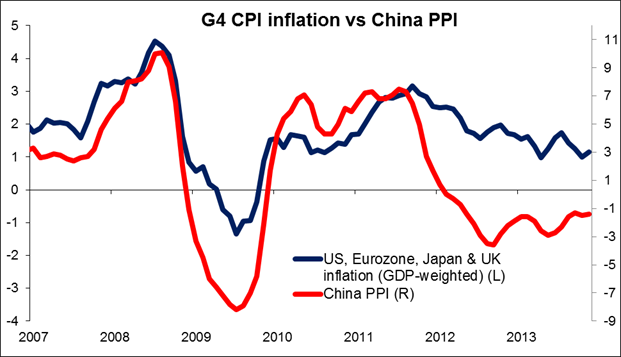
Today’s indicators: Overnight, China announced that its CPI rose 1.6% yoy in October, unchanged from September and in line with expectations. The PPI on the other hand fell 2.2% yoy, a faster rate of deflation than in September. Low inflation in China has implications for inflation worldwide, since it means lower import prices nearly everywhere. In Australia, home loans for September fall 0.7% mom, a slightly slower pace than in August but more than expected.
During the European day, the ECB is expected to announce the size of settled covered-bond purchases. In Norway, CPI inflation for October is expected to slow down somewhat, adding to the recent weak data coming out from the country. That is likely to keep NOK under selling pressure, in our view. Bank of England Gov. Mark Carney speaks in Basel, apparently in his role as chairman of the Financial Stability Board, while ECB’s Mersch speaks in Germany.
In the US, we get the new labor market conditions index for October. This is a monthly index that draws on a range of data to give a better sense of the employment conditions. It aims to produce a single measure to gauge whether the labor market is on the whole improving. In September, the index came 2.5, so a reading above that should indicate an improving labor market.
Canada’s housing starts for October are also coming out.
This week: There are no major central bank meetings this week. The Bank of England will publish its quarterly Inflation Report on Wednesday (see below), while the ECB’s Survey of Professional Forecasters comes out on Thursday.
Internationally, the week’s data will center on inflation and production. CPI data came out from China and will be released from Germany, France, Italy and several other European countries. Industrial production figures are coming out from China, Japan, and the EU.
Friday’s preliminary Q3 GDP figures for the Eurozone will be the big Eurozone indicator for the week. Many of the individual countries will also release their growth figures. Eurozone’s preliminary GDP for Q3 is expected to have moderately expanded from a stagnating Q2, while figures released from Germany, Europe’s strongest economy are likely to show that the economy expanded 0.1% qoq in Q3 from a -0.2% qoq contraction in Q2. The recent disappointing German factory orders and industrial production in September, increase the possibility for a below-expectations reading. Other EU data out this week includes the Sentix index of investor confidence.
China has a considerable number of indicators coming out this week. In addition to those already mentioned, retail sales, foreign direct investment and fixed asset investment are due out. That could cause some volatility in AUD and NZD.
Britain’s labor statistics on Wednesday are likely to be one of the main events of the week. The nation’s unemployment rate for September is expected to decline to 5.9% from 6.0 and average weekly earnings are expected to rise, indicating less slack in the labor market. In addition, the BoE inflation report will have new forecasts for growth and inflation. These should give us more insights into the recent data that suggest a slowing pace of growth.
The U.S. data calendar is comparatively light. Friday’s retail sales figure for October, will perhaps be the biggest indicator. It’s expected to show a rise in sales, which could be dollar-supportive. Thursday’s Job Opening and Labor Turnover Survey (JOLTS) is expected to show a decrease in job openings.
The Market
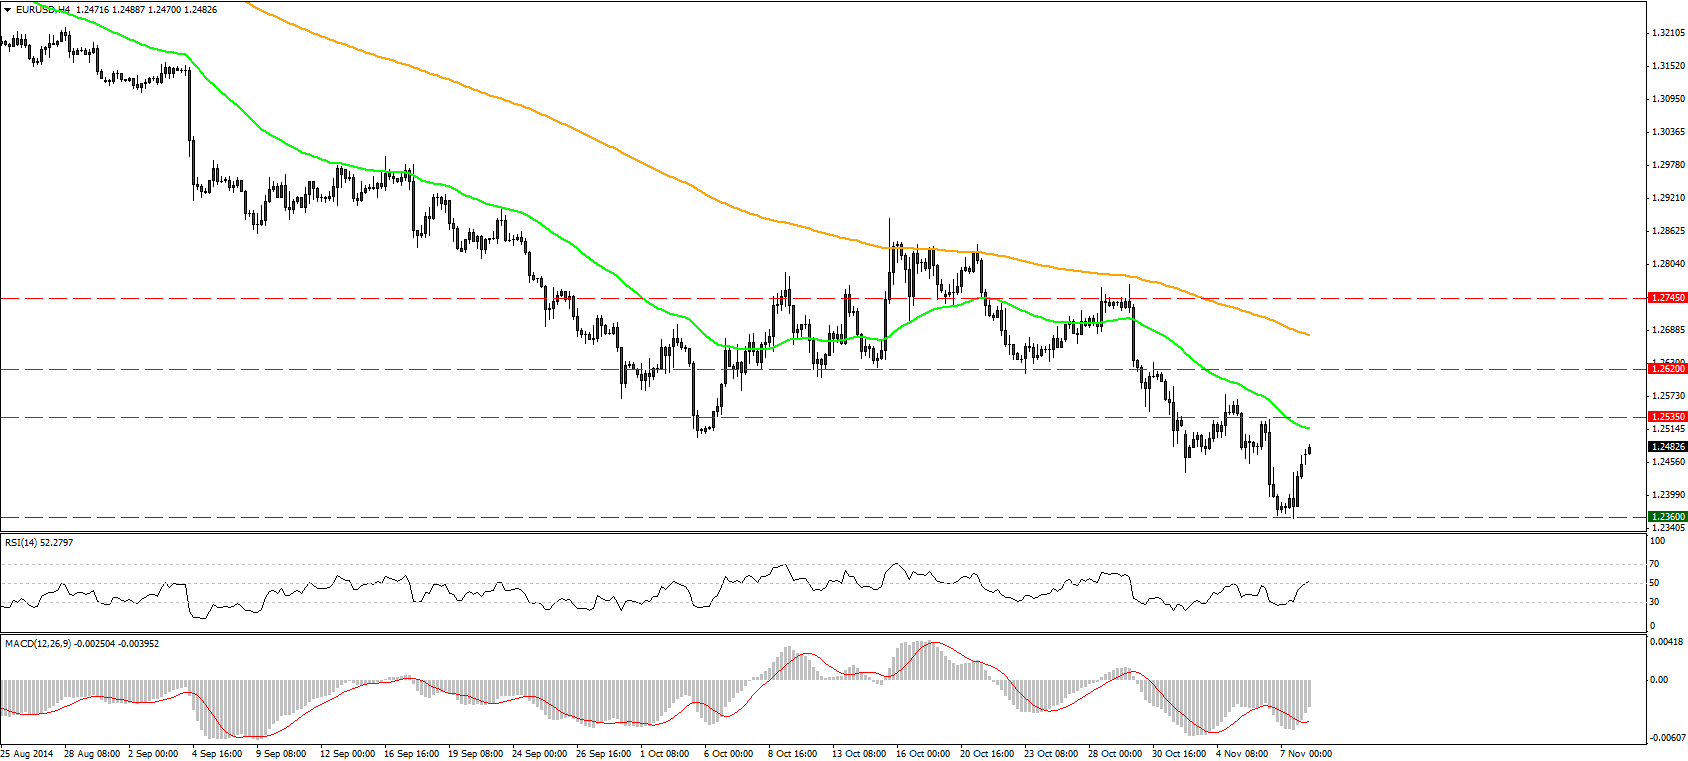
EUR/USD surged above 1.2400 after the US nonfarm payrolls
EUR/USD advanced on Friday, breaking above the 1.2400 level, after the US nonfarm payrolls for October fell short of expectations and disappointed the market. On Monday, EUR/USD moved further higher in early European session towards a well-tested resistance area of 1.2535 (R1). A clear break of that level is needed for further extensions. In the bigger picture, the price structure remains lower highs and lower lows below both the 50- and the 200-day moving averages. Hence, I consider the overall outlook of EUR/USD remains negative. Taking a look at our daily momentum indicators, the RSI moved higher after finding support at its 30 line and is pointing up, while the daily MACD remains below both its zero and signal lines. I also observe positive divergence between both oscillators and the price action, which favor a correction.
• Support: 1.2360 (S1), 1.2300 (S2), 1.2250 (S3).
• Resistance: 1.2535 (R1), 1.2620 (R2), 1.2745 (R3) .
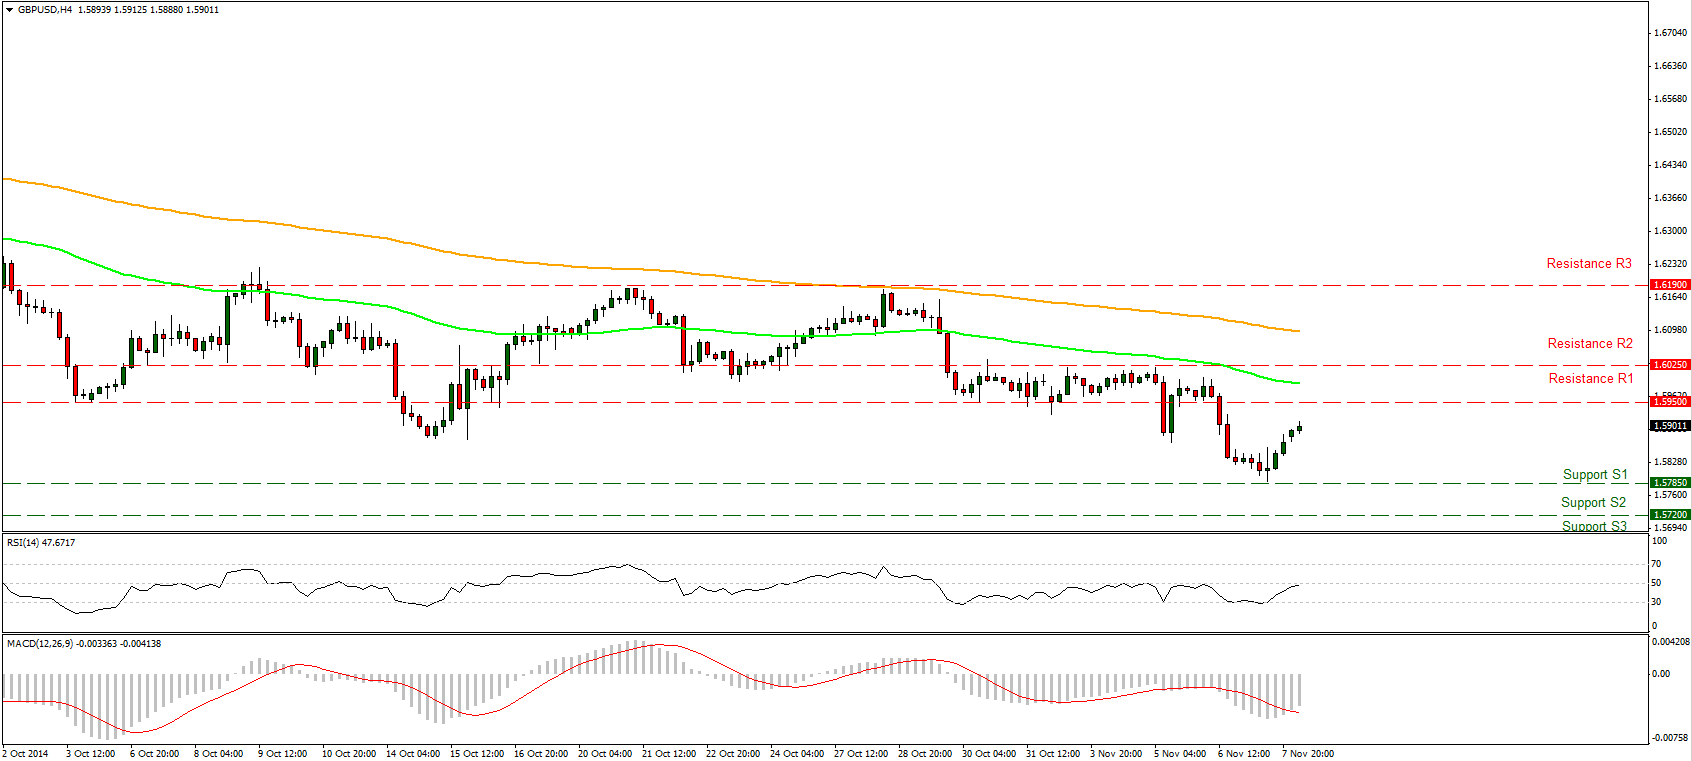
GBP/USD advances after finding support at 1.5785
GBP/USD moved higher following the below-estimate rise in US nonfarm payrolls and currently is heading towards our resistance of 1.5950 (R1). A break above that line could target our next resistance of 1.6025 (R2). However, bearing in mind our momentum signs, I would prefer to take the sidelines as far as the short-term picture is concerned. The RSI seems to find resistance at its 50-line, while the MACD, already in its negative territory, is pointing down. As for the broader trend, I maintain the view that as long as Cable is trading below the 80-day exponential moving average, the overall path remains negative. But I would prefer to see a break below 1.5785 (S1) before getting again confident on the downside. Such a dip would signal a forthcoming lower low on the daily chart and could trigger extensions towards the next support barrier of 1.5720 (S2), defined by the high of the 21st of August 2013. Moreover, I still see positive divergence between our daily oscillators and the price action. This confirms my view to wait for a move below 1. 5785 (S1) to signal the continuation of the down path.
• Support: 1.5785 (S1), 1.5720 (S2), 1.5665 (S3).
• Resistance: 1.5950 (R1), 1.6025 (R2), 1.6190 (R3).
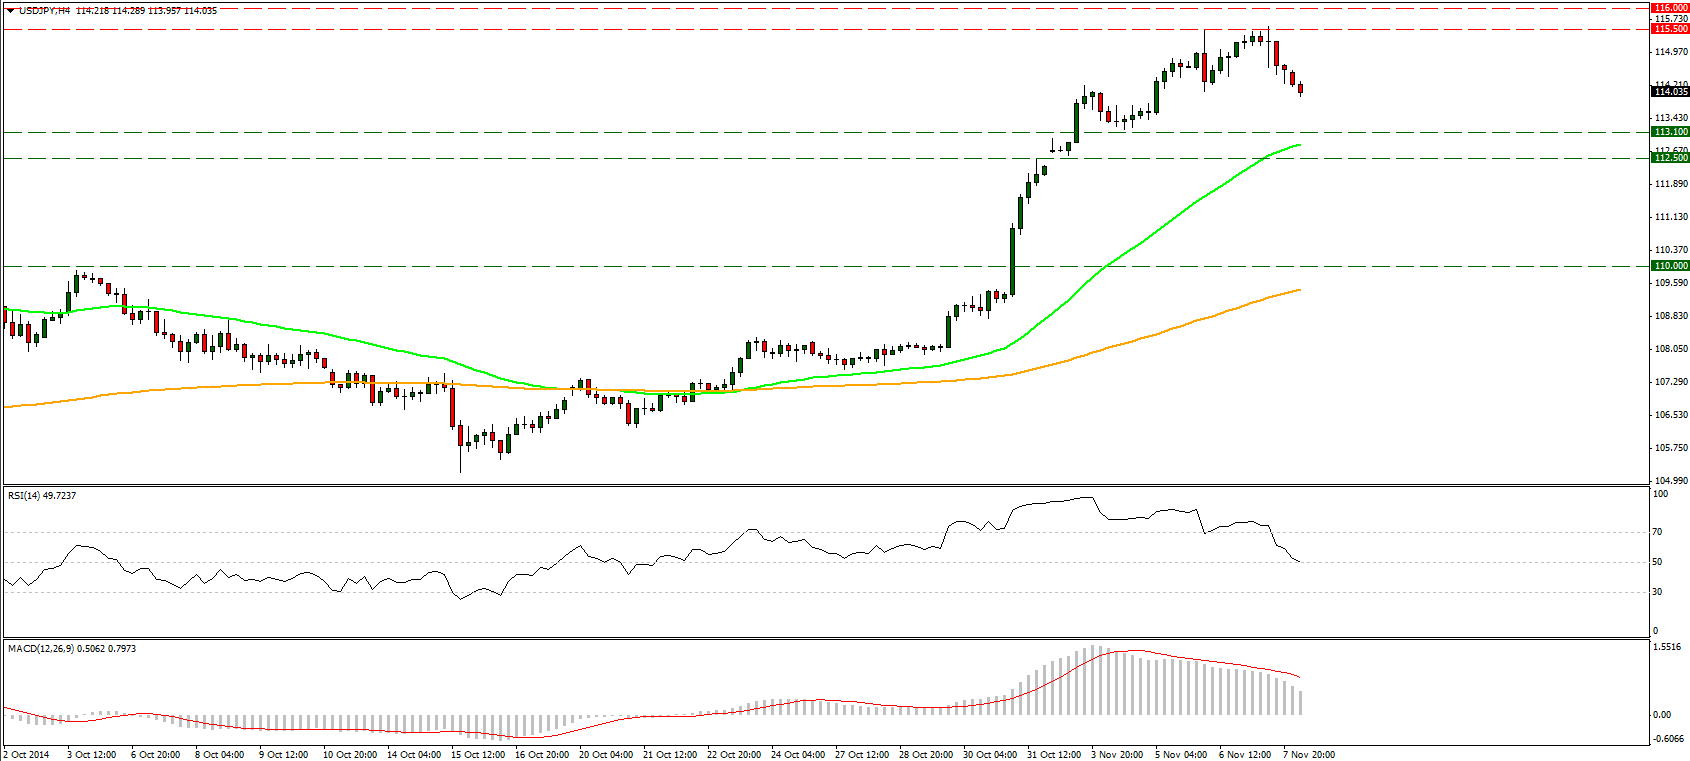
USD/JPY declined after touching 115.50
USD/JPY declined after finding resistance at 115.50 (R1) level. During the early European hours, the pair is heading towards our 113.10 (S1) support line, which happens to be the 23.6% retracement of the 15th October- 7th November advance. A break below that level could pave the way to 112.50 (S2) support zone. On the daily chart, the rally above 110.00 (S3) confirmed a forthcoming higher peak, something that keeps the overall path of USD/JPY to the upside. Furthermore, the daily MACD rebounded from marginally below zero, turned positive, and crossed above its signal line, while the 14-day RSI moved down towards its 70 line and it seems ready to cross it. Our mixed momentum signs give me a reason to stay on the sidelines now until a better technical picture.
• Support: 113.10 (S1), 112.50 (S2), 110.00 (S3).
• Resistance: 115.50 (R1), 116.00 (R2), 117.00 (R3).
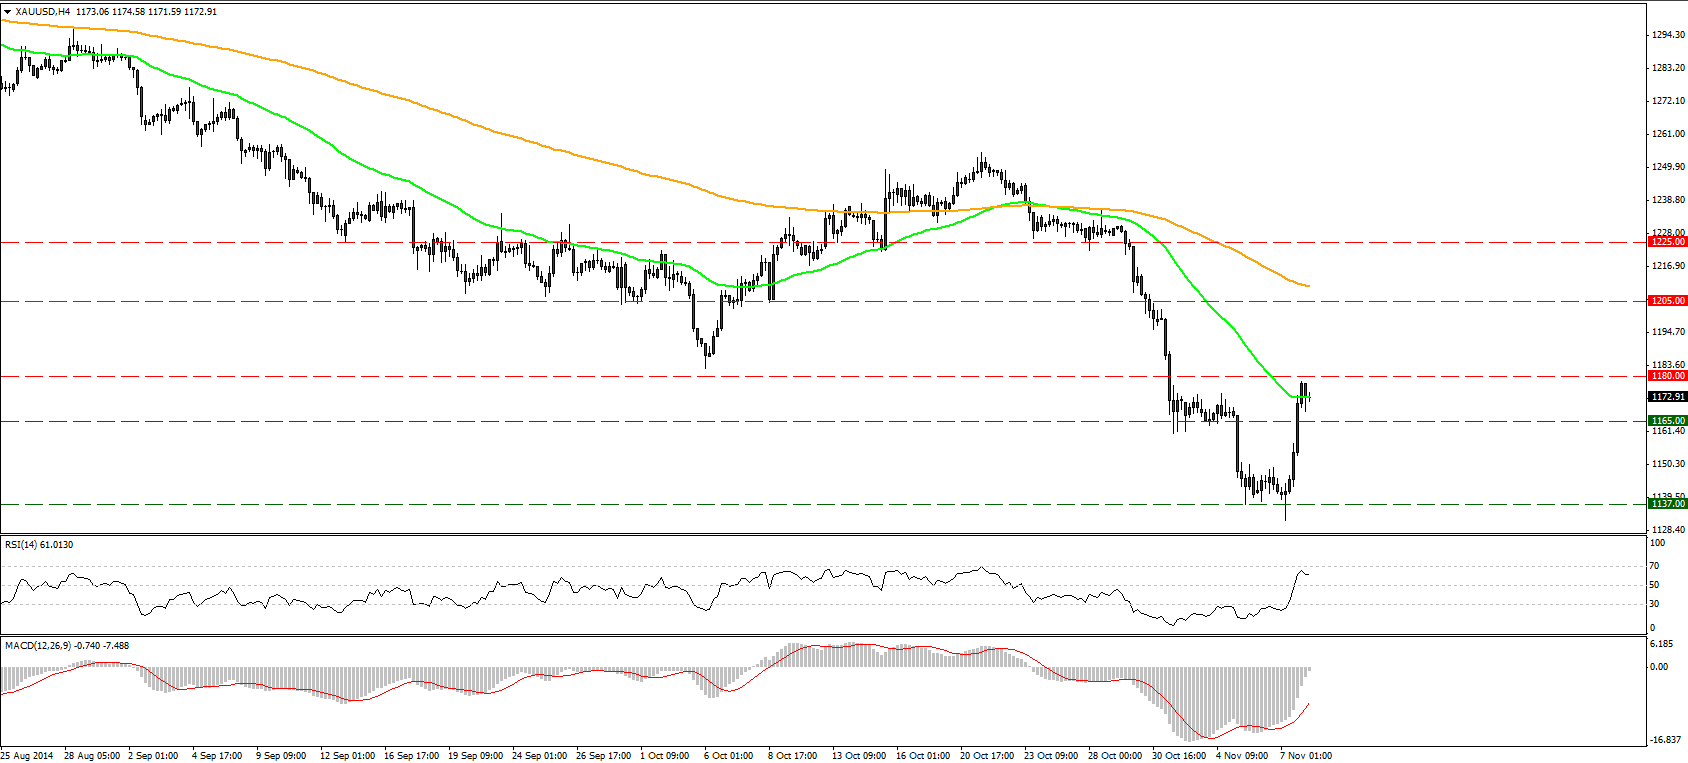
Gold remains below the key 1180 level
Gold moved in a consolidative manner on Monday, after breaking our resistance-turned-into-support line of 1165 (S1). The price structure still suggests a downtrend but I would prefer to stay on the sidelines since the move higher was halted just below our previous strong level of 1180. A break above that zone is needed for the precious metal to target our next resistance of 1205 (R2). Our momentum studies support this notion, as our daily RSI remains below its 50 line and is pointing down, while the daily MACD remains below its zero and trigger lines.
• Support: 1165 (S1), 1137 (S2), 1125 (S3).
• Resistance: 1180 (R1), 1205 (R2), 1225 (R3).
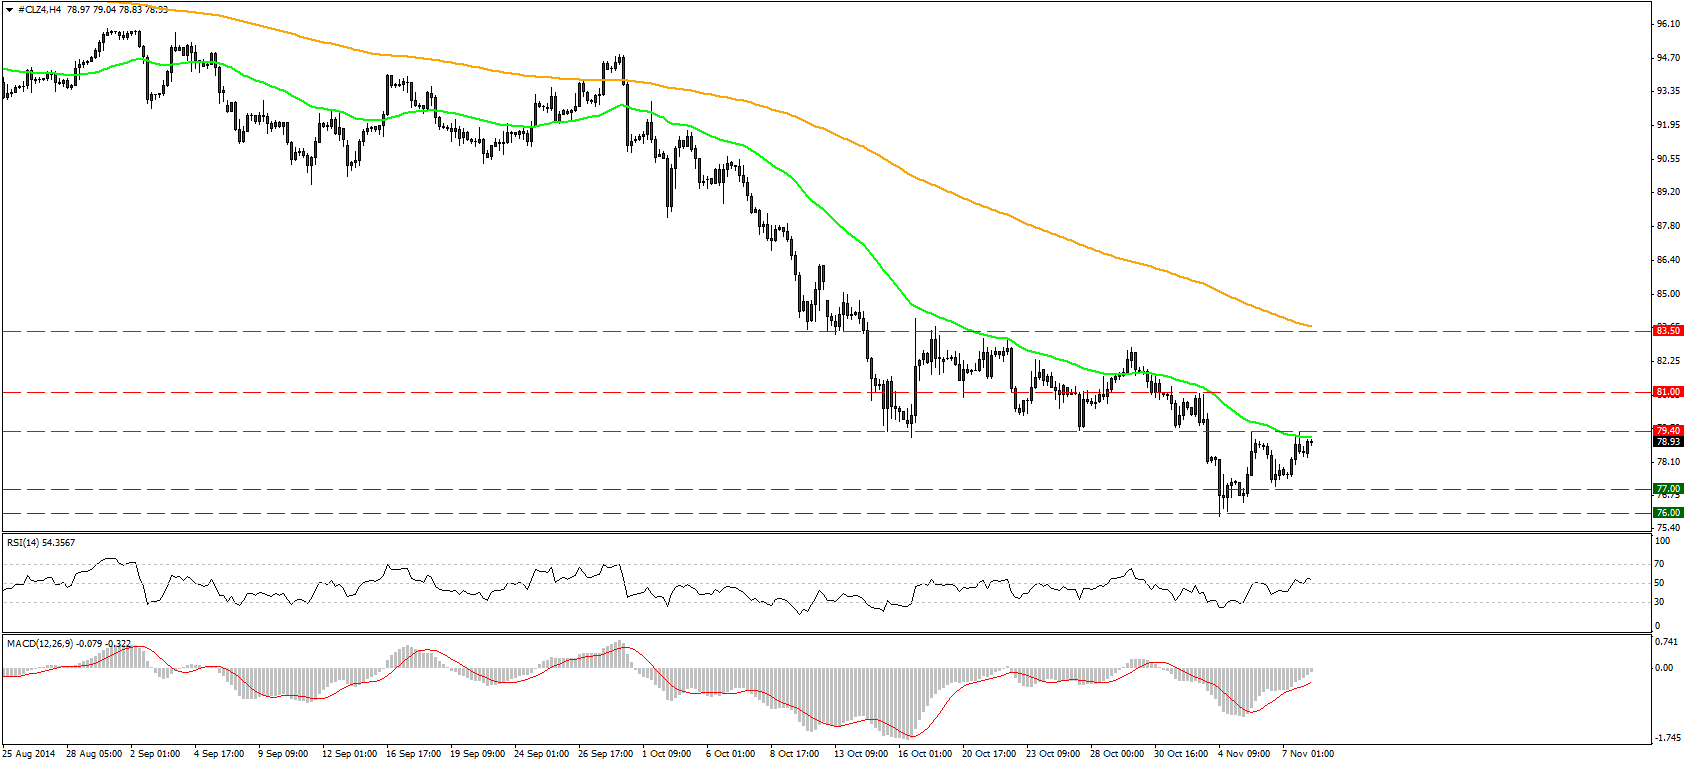
WTI declines after testing the 79.40 line
WTI tumbled after testing the 79.40 (R1) line as a resistance again. This partially confirms my view that as long as this line holds as a resistance, the near-term outlook is cautiously negative. I would now expect sellers to challenge again the barrier of 76.00 (S2). Breaking that could challenge the psychological zone of 75.00 (S3), defined by the lows of October 2010. On the daily chart, the price structure remains lower lows and lower highs below both the 50- and the 200- day moving averages, keeping the overall trend to the downside.
• Support: 77.00 (S1), 76.00 (S2), 75.00 (S3).
• Resistance: 79.40 (R1), 81.00 (R2), 83.50 (R3).

