As long as central banks around the globe are creating monetary credits at a breakneck clip of $200 billion per month, assets from stocks to real estate to higher yielding securities may have a floor underneath them. In particular, saber rattling in North Korea, government shutdown threats, natural disasters from Harvey to Irma, slower job growth and/or the demise of big name retailers may not cause long-lasting stock declines.
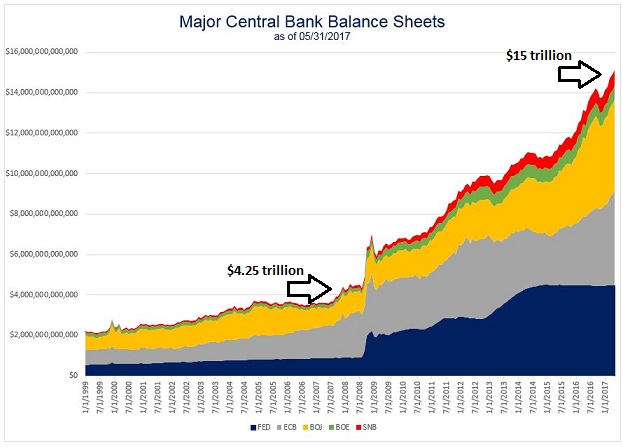
And therein lies a problem: extreme complacency. The masses are beginning to think that central banks are omnipotent and that low interest rates are a panacea. The truth? Hyper-inflated asset balloons are always at risk of bursting.
It is instructive to recollect that few people seemed troubled by over-hyped technology stocks in 1999; few folks believed that property prices had become unhinged from reality in 2007. In both instances, the masses viewed severely overvalued assets in a favorable light, right up until they crashed.
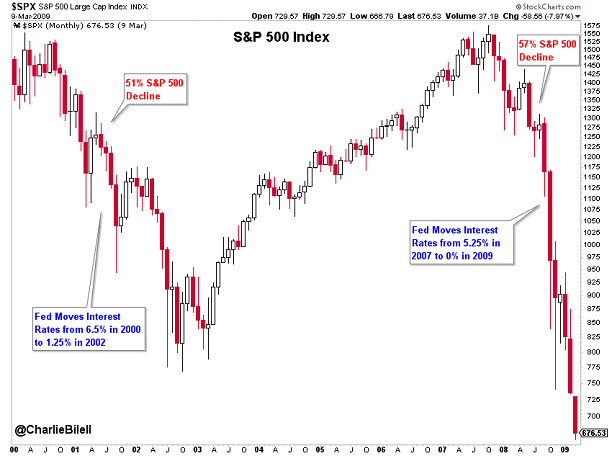
Could our Federal Reserve stop the stock market from plummeting 50% in the 2000-2002 tech wreck? It could not. Was the central bank of the United States able to lessen the 2008-2009 subprime mortgage pain that led to 50% stock market losses? It could not.
Central banks certainly do not have a track record for preventing forest fires in financial markets. Yet stocks have not dropped as much as 3% for 10 months already. That is the third longest streak without a 3% pullback since World War II. Historically speaking, 3%-5% pullbacks occur on average once every three months.
“Gary, it’s more than the central bank support. The economy is fundamentally solid.” I do not agree. A majority of critical indicators – the rate of job growth, the pace of credit expansion, the breakdown in key economic sectors – demonstrate unambiguous deceleration.
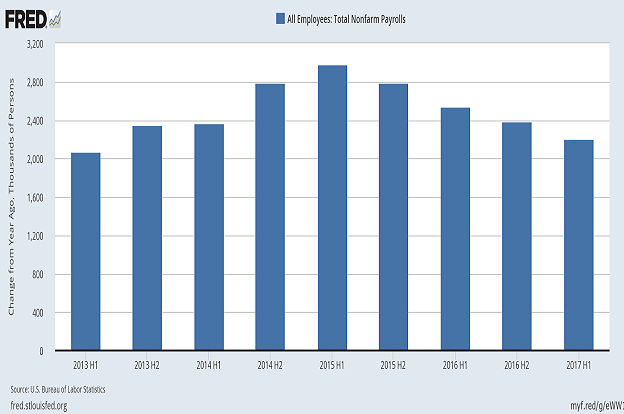
Take a look at the employment picture. The year-over-year job expansion peaked in the first half of 2015. Since then, the U.S. has been adding fewer and fewer jobs to its payrolls.
One of the reasons for the unappealing trend? Workers 25 years and older with only a high school degree. In fact, the employment-to-working-aged-population ratio for this segment has seen zero improvement since the end of the Great Recession.
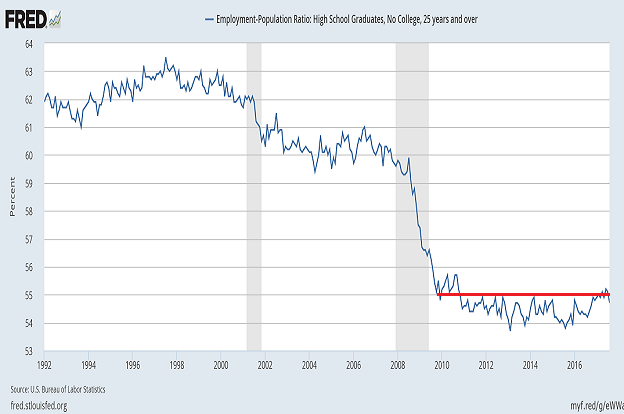
Of course, economic well-being is not synonymous with people securing work. Nor is it equivalent to gross domestic product (GDP) – a measure of the total value of goods produced and services provided in a given time period. On the other hand, if fewer and fewer net jobs pay desirable enough wages, the ability to consume those goods and services would rely much more heavily on credit (a.k.a. ‘debt’).
Perhaps unfortunately, the credit cycle already appears to be waning. Banks have been less willing to lend to consumers. For that matter, they’ve been getting stingier with commercial/industrial enterprises as well.
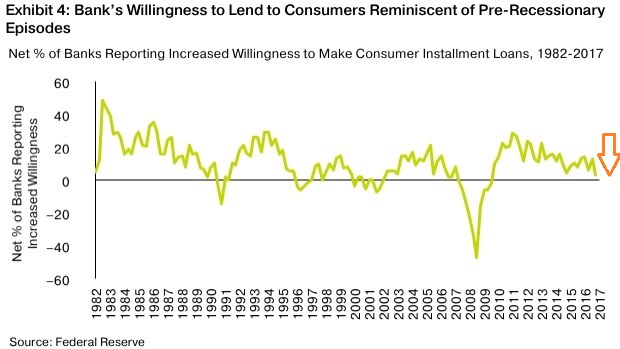
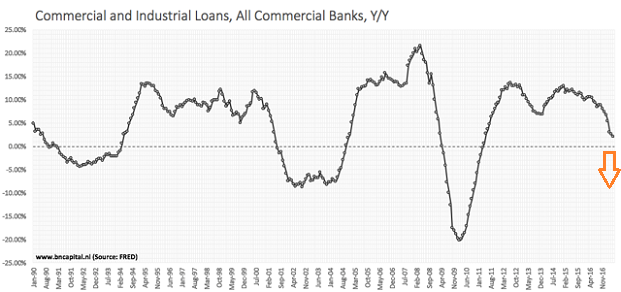
In spite of the potential for consumers and businesses to struggle with accessing credit, most market-cap weighted sectors have been performing remarkably well. Rarely a week goes by without the SPDR Technology Select Sector SPDR (NYSE:XLK) hitting a new record. Similarly, SPDR Health Care Select Sector (MX:XLV) (NYSE:XLV) has been humming on biotech enthusiasm, SPDR Utilities Select Sector (MX:XLU) SPDR (NYSE:XLU) has been rocketing on yield-seeking speculation from a non-cyclical segment and SPDR Basic Materials Select Sector SPDR (NYSE:XLB) has been hitting new highs on manufacturer demand from abroad.
Yet the cracks underneath the surface should not be dismissed outright. The idea that retailers have been dealing with bearish price depreciation is disquieting, even if one believes that Amazon (NASDAQ:AMZN) has picked up all of the slack. Meanwhile, the notion that the stock prices for a variety of energy explorers, producers, transporters, refiners and services hover at 52-week lows is troublesome to the S&P 500 earnings recovery story.
Most Discouraging?
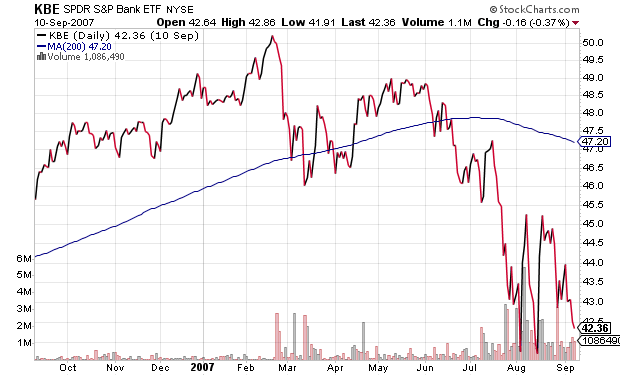
The SPDR S&P Bank (MX:KBE) ETF (NYSE:KBE) is breaking down. In fact, some folks forget that KBE experienced a similar fall from grace long before the start of the financial crisis bear in October of 2007.
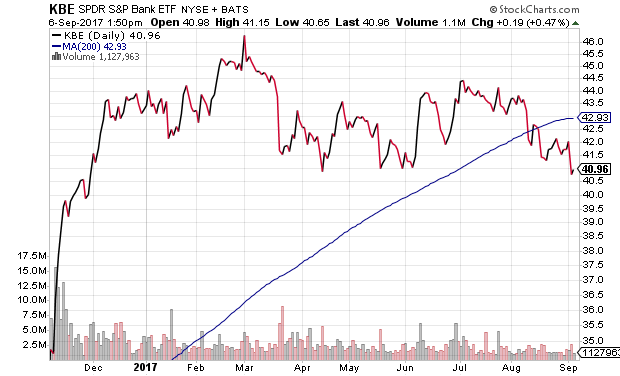
I am not one to buy into ex-retail, ex-bank and ex-energy to justify extreme price overvaluation. Nor am I one to ignore the way in which GDP is calculated; that is, GDP will only add the rebuilding activity in Houston (post-Harvey) and South Florida (post-Irma) without subtracting anything for the devastation. In other words, GDP data will not address the loss of assets.
What we have, then, is the same calendar year GDP growth of 2% – an expansion that will be constrained by weakening employment trends and an aging credit cycle. The fact that a recession may not be imminent is only soothing to those who believe that monumental tax reform and ongoing central bank stimulus will send stocks skyward from here.
However, this is not 1980. Lance Roberts of Real Investment Advice points out that consumption moved from 61% to 67% of the overall economy with the aid of $5.6 trillion in additional household debt. In the last 17 years, $6 trillion more in household credit was required to move the needle 2% to 69%. In other words, less household debt was needed to increase consumption by 6% of the economy (1980-1999) than what was needed to move it 2% in this century (2000-2017). With households already levered to the hilt, and with interest rates near rock bottom, the capacity to boost a consumer-oriented economy to enhanced GDP growth rates of 3%-4% annually probably does not exist.
Bottom Line?
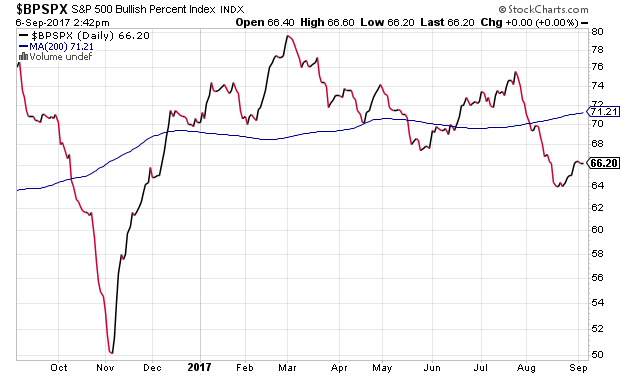
Pay attention to market internals, from breakdowns in significant sectors to yield curve flattening to the number of stocks in a technical uptrend. Two-thirds of S&P 500 stocks in a technical uptrend is nice, but four-fifths during the March 2017 highs was nicer.
