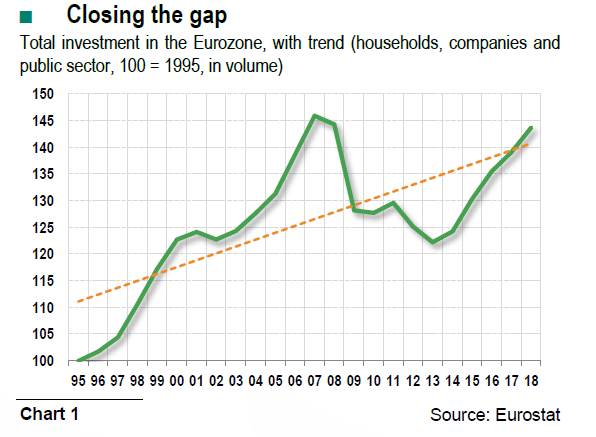
- From 2008 to 2013, the eurozone experienced a sharp decline in investment. Despite a belated turnaround in 2014, total investment is still holding below its pre-crisis level.
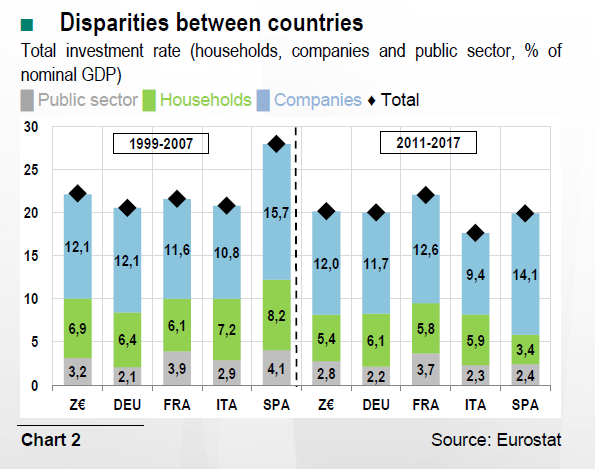
- There are wide disparities between countries. After the crisis, the investment rate dropped off sharply in Spain, for example, but rose in France.
- The share of investment allocated to intangible assets, notably research and development, has increased to the detriment of tangible assets.
A protracted period of declining investment
In the eurozone, the back-to-back financial and sovereign debt crises of 2008 and 2012 had a prolonged impact on investment (see chart 1). Several factors hampered investment decisions, notably the increase in the cost of financing, especially in the countries hit hardest by the 2011- 12 crisis, and more generally, the difficult access to credit at a time of major financial fragmentation1. Another major factor was the high level of uncertainty, which placed a significant and ongoing strain on investment2. After 2009, the difficult turnaround in fixed gross capital formation (FGCF) also occurred at a time when the eurozone’s already high level of public debt continued to rise, and aggregate demand remained weak3, notably in some of the southern European countries.
A belated but notable turnaround
In the post-crisis period (2011-2017), the average investment rate for the eurozone was about 2 points of GDP lower than in the pre-crisis period (1999-2007). This decline can be seen in most of the major economies4, with the exception of France, where the investment rate increased slightly to an average of 22% of GDP in the post-crisis period5 (see chart 2). Although the investment rate did not decline much in Germany, it fell much more sharply in Italy (-3.2 points to 17.7% of GDP) and especially in Spain (-8 points to about 20%). This suggests a correction following the emergence of major surplus capacity before the crisis, notably in the construction sector6.
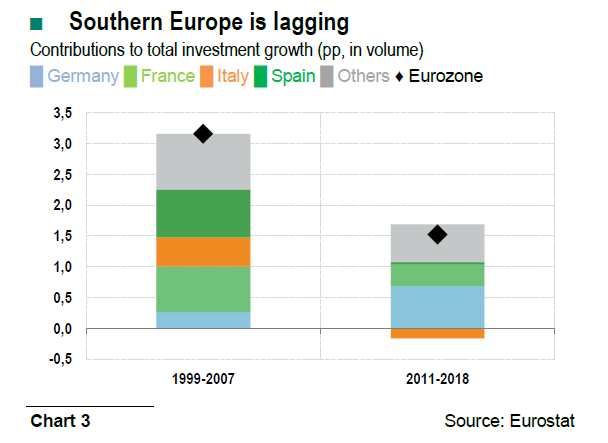
In the eurozone, the average growth in volume of investment (see chart 3) was cut in half between the two periods (from an annual average of 3.2% in 1999-2007 to 1.5% in 2011-2018). The slight decline in Germany’s investment rate masks a sharp acceleration in the volume of GFCF. After a period of sluggish growth before the crisis (averaging about 1%), the total volume of investment rose 2.5% in Germany in the postcrisis period. All in all, Germany made a strong contribution to the investment dynamics of the eurozone as a whole during this period.
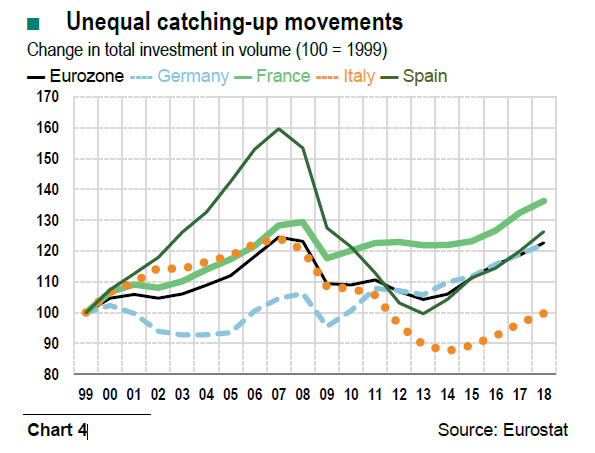
In Spain, where investment had reached levels that were hardly sustainable, the 2008 crisis triggered a sharp correction that brought investment in 2013 to the 1999 level. Since then, there has been a strong and sustained rebound in investment. Italy’s investment profile is unique. After declining for seven consecutive years (2008-2014), the volume of investment returned to positive growth in 2015, but by 2018, it had only barely returned to the 1999 level (see chart 4).
Greater investment in intangible assets
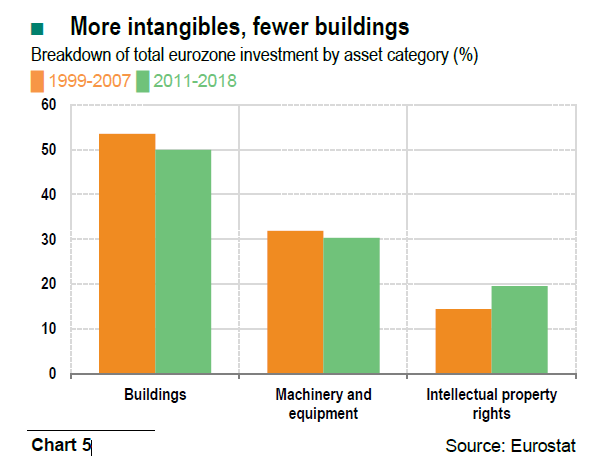
The decline in the eurozone’s overall investment rate was accompanied by a slight shift in its composition between the pre-crisis and post-crisis periods. Intangible assets7 as a share of total GFCF increased to about 20% to the detriment of tangible assets, including buildings and “machinery and equipment” (see chart 5). The growing importance of intangibles as a share of investment can be seen in the four major eurozone economies. Yet the share is still relatively small in Spain (averaging 14.5% of the total in the post-crisis period) and Italy (15.7%), compared to France (23.4%) and to a lesser extent Germany (18.1%). Inversely, “machinery and equipment” as a share of GFCF was not as high in France as in the other three major economies, reflecting in part the relative weakness of industrial value added (excluding construction) as a share of total value added (14% in 2018 in France vs. 26% in Germany and a little less than 20% in Italy and Spain).
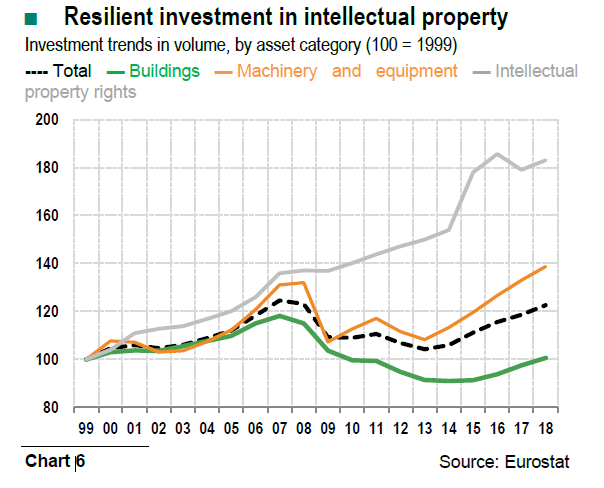
Investment profiles in volume confirm the dynamic pace of investment in “intellectual property rights”8 (see chart 6). Investment spending on “machinery and equipment” was hard hit by the crisis, and notably by the world trade shock of 2009. Inversely, investment spending on “intellectual property rights” does not seem to have been hit as hard: it remained virtually flat in 2007-2009 before picking up again as of 2010. This resilience can be seen not only in Germany and France (bolstered by the research tax credit reforms9) but also in Spain.
R&D effort must still be confirmed
Among the market sectors in the major eurozone economies, investment rates are especially high for industry (excluding construction) and “information and communication services”, suggesting a high level of capital intensity.
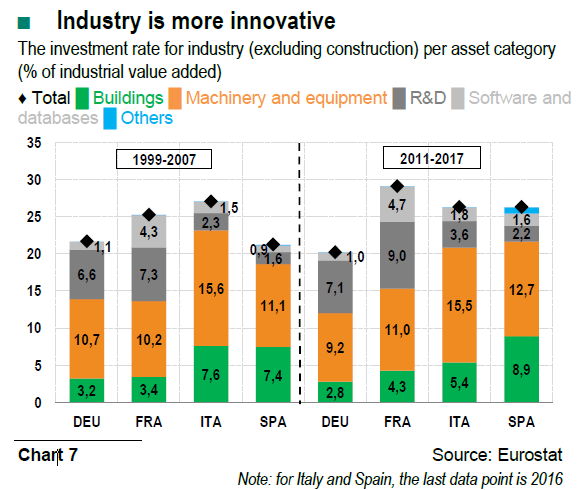
In industry, the average investment rate increased in the postcrisis period in France and Spain, whereas it declined slightly in Germany and Italy (see chart 7). Yet industry’s investment rate in intangible assets increased across the board10, especially for “research and development” (R&D). In this segment, the investment rate remained relatively low in Spain (2.2% of industrial value added) and Italy (3.6%) compared to Germany (7.1%) and especially France (9%). This latter observation must be kept in perspective, however, given industry’s relatively weak position in France’s productive fabric. In information and communications services, where productivity is relatively high and dynamic, the investment rate also increased for intangible assets in the major eurozone economies, following the same trend as industry. Moreover, it reached a relatively high level compared to other market services. This dynamic pace could partially reflect an intensely competitive environment, which encourages companies to move upmarket, and in general, tends to exclude the weakest companies from the market.
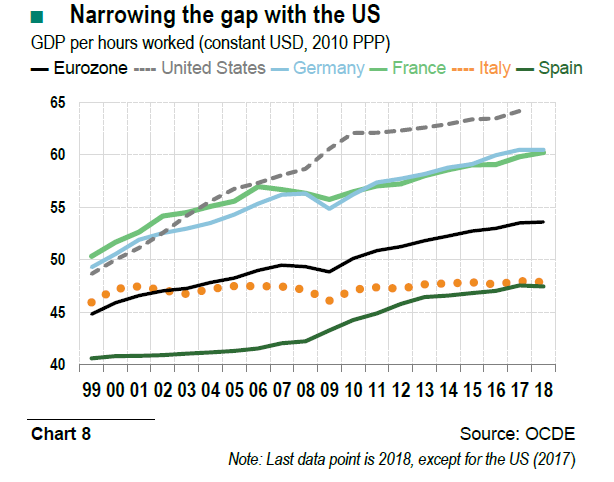
Although eurozone investment has been slowing on the whole, it has tended to shift increasingly towards intangible assets, notably in industry and certain productive services. Investment in R&D will have beneficial effects on the dynamics of productivity in both the short and long term. R&D efforts will have to be maintained and supported. All other factors being the same, although the level of productivity in the eurozone countries is relatively high, in terms of GDP per hour worked, the eurozone has fallen behind the United States since the crisis (see chart 8). There is thus room to close the gap.
By Louis BOISSET
