
The dollar was mostly lower against the G10 currencies but higher vs EM currencies Wednesday. Comments by outgoing Fed Chairman Bernanke that rates will remain low long after the Fed has ended its monthly bond purchases, coupled with comments from Chicago Fed President Evans that the Fed should wait until next year, possibly March, before beginning to taper off the bond purchases, kept the dollar under pressure.
It’s noticeable though that the euro managed to firm despite some dovish comments from ECB officials. ECB Vice President Constancio said once again that the ECB has all instruments on the table, a theme reinforced by fellow board member Praet, who added that it could take four years to close the output gap in Europe. The euro was momentarily weakened by such comments but quickly bounced back, indicating perhaps that market participants think there is more disagreement on strategy on the ECB Council than there is with the Fed. The ECB members all seem to agree that they are discussing further measures and are technically ready to implement them, but there does not seem to be the same degree of commitment to act yet. Tomorrow’s preliminary Eurozone purchasing managers’ indices could either confirm or shift attitudes. The market is looking for a modest rise in both the manufacturing and services PMIs; further improvement could reinforce the idea that the ECB is in a “wait-and-see” mode, thereby boosting the EUR/USD, while a surprise deterioration would push the possibility of further ECB action back into center stage.
The main exception was the USD/JPY, which rose after Japan posted its biggest October trade deficit ever. The need to import oil is crushing Japan’s trade account and adding to the pressure for the Bank of Japan to support the economy. I expect the yen to weaken further.
The focus today will be on the release of the minutes from the recent Bank of England and FOMC meetings. Last month’s BoE minutes sent the GBP/USD higher by around 15 pips immediately, but the pair turned around and was down around 40 pips from the peak in half an hour on the Bank’s view that lower rates were helping the economy. This time I expect the minutes to have less impact as they might not add much to what we know after the recent inflation report. The FOMC minutes are likely to be more informative but not necessarily more market-moving. The release of the September minutes sent the EUR/USD down 25 pips right away but the pair recovered all the losses within an hour, and it’s arguable that the September minutes were more important as they explained the surprise decision not to taper off the Fed’s bond buying program. Today the market will be looking to see if there is any consensus on the FOMC about when to start tapering and whether to strengthen the Fed’s forward guidance.
The only important indicators are from the US, and the market consensus for them is largely USD-negative. Retail sales for October are expected to rise 0.1% mom, a turnaround from a contraction of the same pace in September. Excluding autos and gasoline, retail sales are estimated to be up 0.2% mom, a slowdown from +0.4% in September. The headline CPI for October is estimated to be unchanged mom vs a 0.2% mom rise in September, bringing the yoy rate of change down to 1.0% from 1.2%. Slowing inflation could also be negative for the dollar today. Finally, adding to the dollar’s woes, existing home sales for October are expected to have declined 2.7% mom, a faster rate of decrease than -1.9% mom in September. There are four main speakers today: BoE Chief economist Spencer Dale and MPC member Martin Weale, while in the US, the talkative New York Fed President Dudley speaks again, as does St. Louis Fed President Bullard. Dudley’s previous comments were mixed – his prepared comments were relatively confident on the economy but his view during the Q&A was more dovish, so the markets will be listening closely to him today for further clarification.
The Market
EUR/USD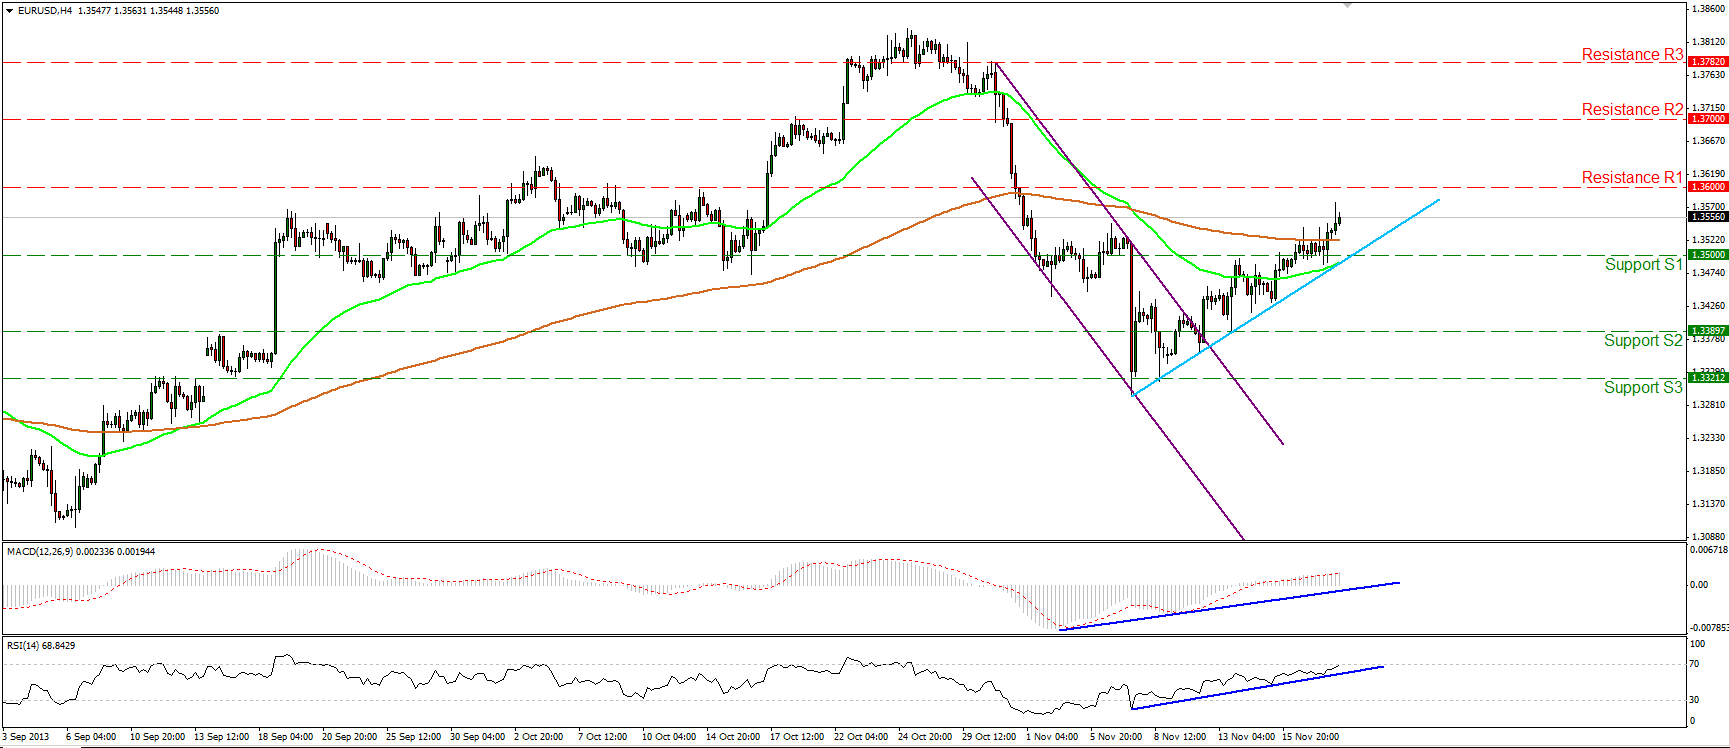 EUR/USD Hourly Chart" title="EUR/USD Hourly Chart" width="1731" height="748">
The EUR/USD moved higher, crossing above the 200-period moving average. The pair is currently heading towards the 1.3600 (R1) resistance barrier, where a decisive violation may trigger extensions towards the next obstacle at 1.3700 (R2). Both momentum studies follow their support lines, confirming the bullish attitude of the pair. The short-term trend remains an uptrend since the rate follows the light-blue support line and only a dip below it would be a reason to reconsider our analysis.
• Support: 1.3500 (S1), 1.3389 (S2), 1.3321 (S3)
• Resistance: 1.3600 (R1), 1.3700 (R2), 1.3782 (R3).
USD/JPY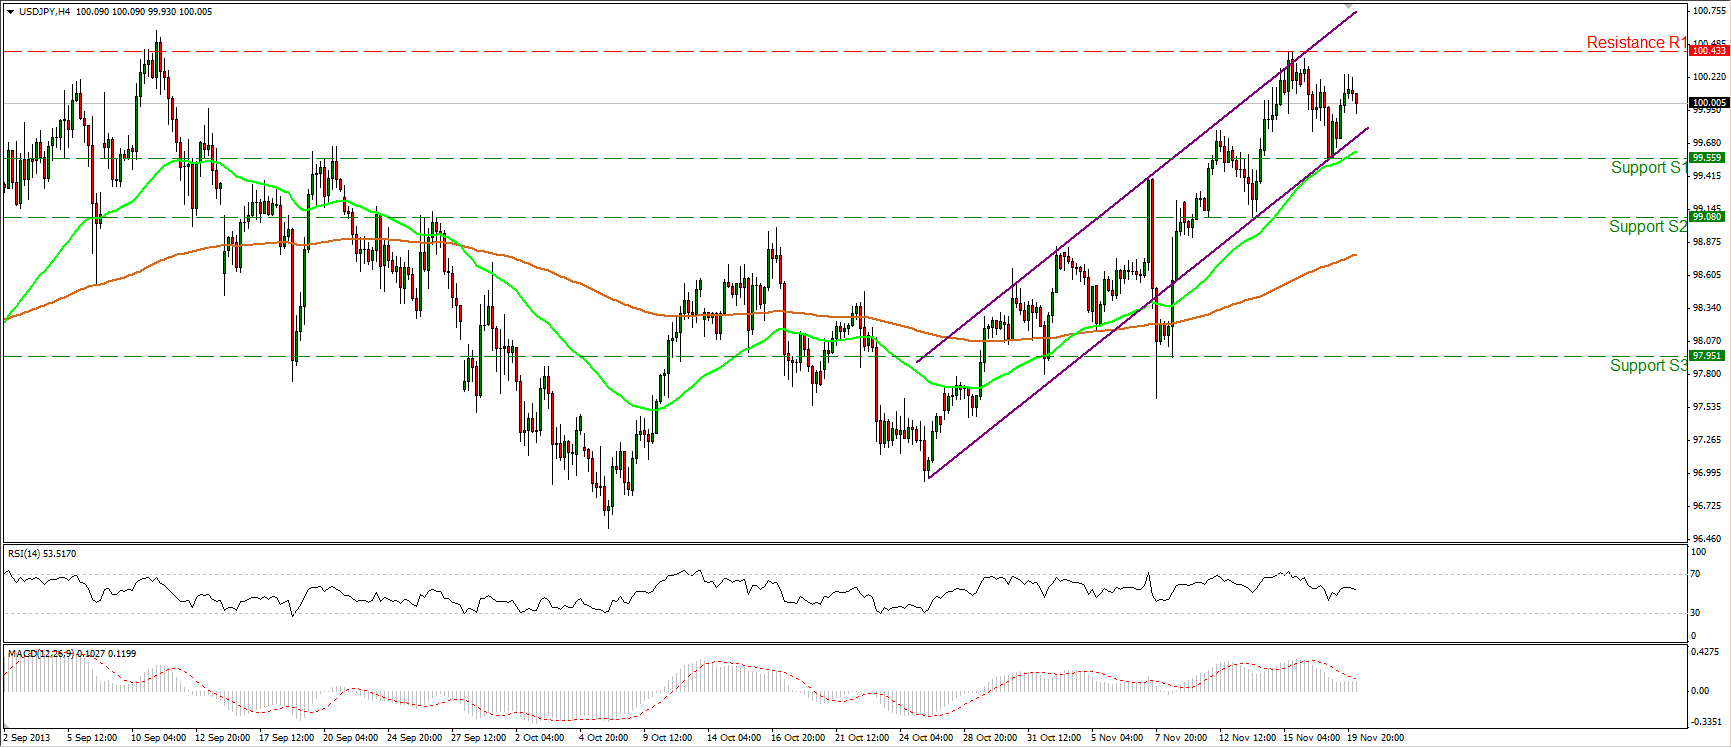 USD/JPY Hourly Chart" title="USD/JPY Hourly Chart" width="1731" height="748">
The USD/JPY moved higher but failed to reach the previous high of 100.43 (R1). The price now is forming a lower peak and a break below the 99.55 (S1) support may signal the completion of a failure swing formation, targeting the next support at 99.08 (S2). Nonetheless, the uptrend remains in effect for now since the price lies within the purple channel and above both the moving averages. On the daily chart, the rate is trading above the upper boundary of a symmetrical triangle formation, suggesting a stronger pair in the next few weeks.
• Support: 99.55 (S1), 99.08 (S2), 97.95 (S3).
• Resistance: 100.43 (R1), 101.44 (R2), 102.40 (R3).
GBP/USD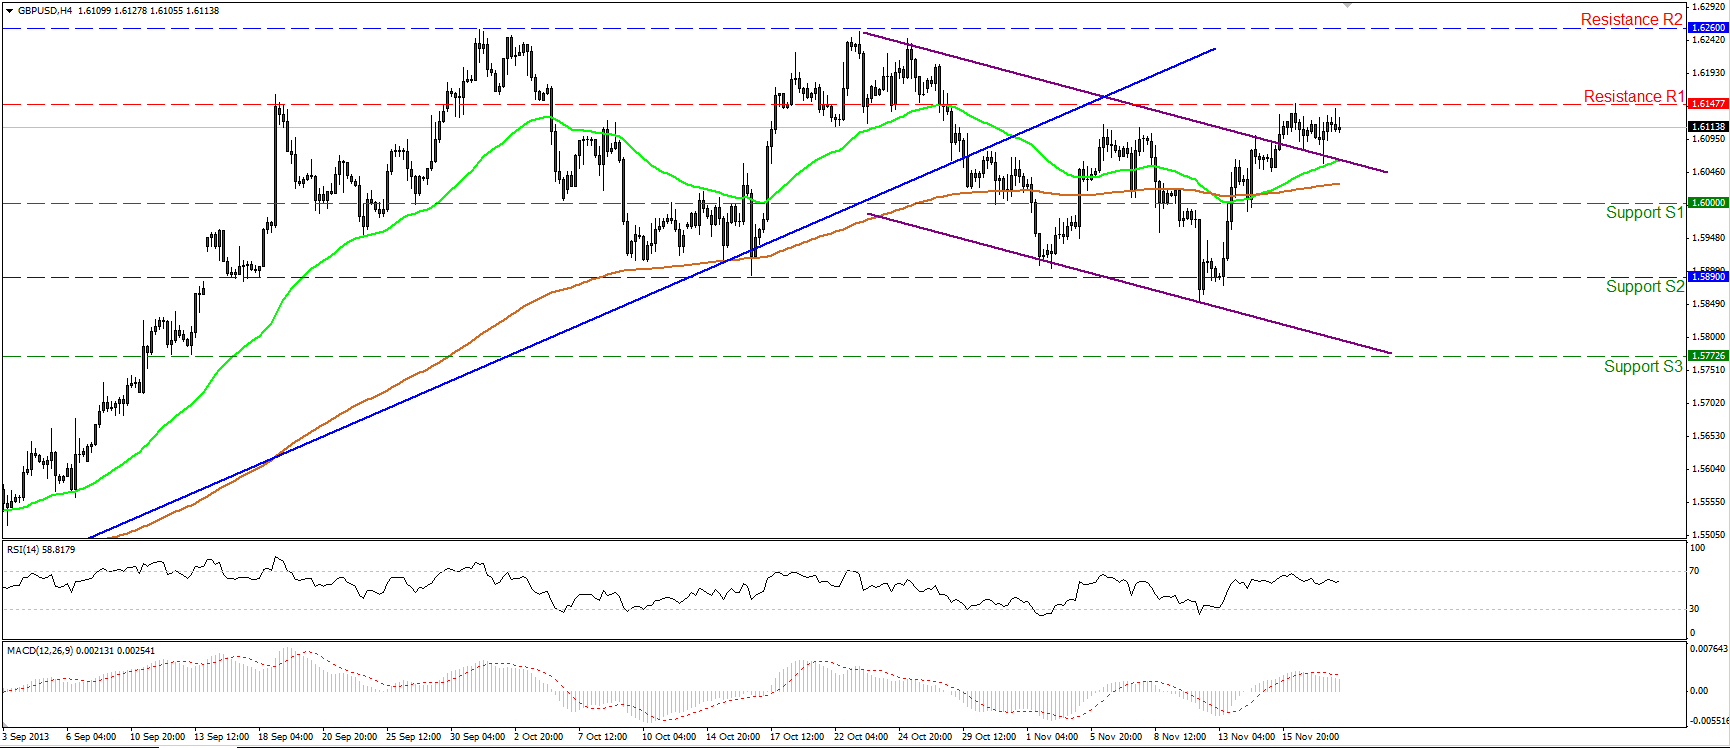 GBP/USD Hourly Chart" title="GBP/USD Hourly Chart" width="1731" height="748">
The GBP/USD moved sideways, remaining below the 1.6147 (R1) resistance level. If the longs manage to drive the rate above that level, they might target the next resistance at 1.6260 (R2). However, the RSI found resistance at its 70 level and moved lower and the MACD, although still in bullish territory, seems ready to cross below its signal line. Thus further consolidation before the advance resumes should not be ruled out.
• Support: 1.6000 (S1), 1.5890 (S2), 1.5772 (S3).
• Resistance: 1.6147 (R1), 1.6260 (R2), 1.6375 (R3).
Gold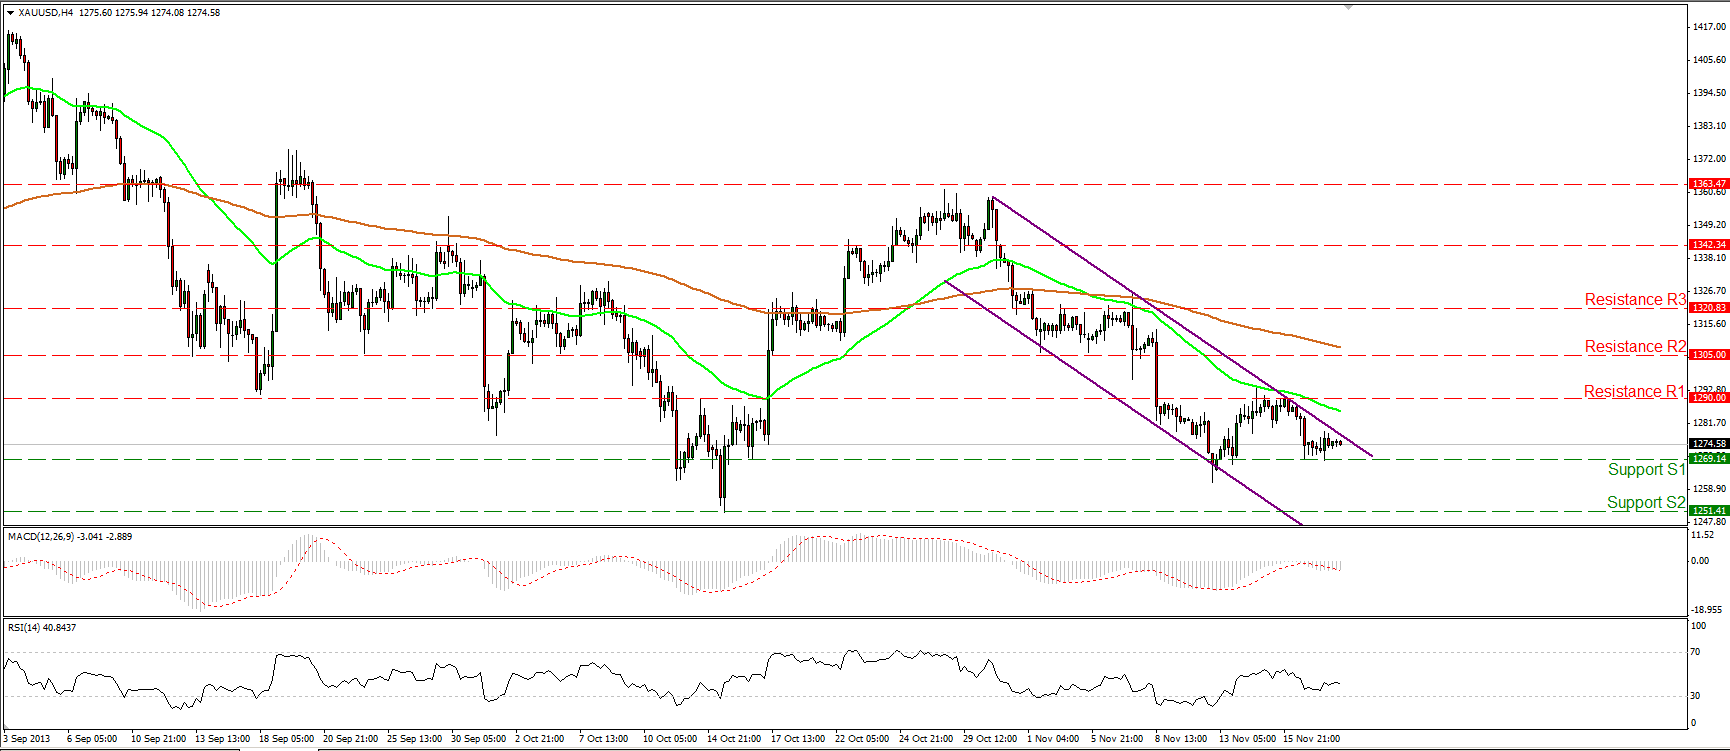 XAU/USD Hourly Chart" title="XAU/USD Hourly Chart" width="1731" height="748">
The Gold also moved in a consolidative manner, remaining above the 1269 (S1) support barrier and getting closer once again to the upper boundary of the downward sloping channel. A decisive dip below the 1269 (S1) level would have larger bearish implications, targeting the next obstacle at 1251 (S2). However, since a doji candle is identified on the daily chart, I remain neutral until a break of the aforementioned support or the upper boundary of the channel occurs.
• Support: 1269 (S1), 1251 (S2), 1221 (S3).
• Resistance: 1290 (R1), 1305 (R2), 1320 (R3).
Oil
WTI moved higher, returning above the 93.14 (S1) level. The bears were not strong enough to maintain the price below that level and the continuation of the upward corrective wave may target the 95.36 (R1) resistance barrier and the upper boundary of the blue channel. The overall trend remains a downtrend as indicated by the blue downward sloping channel and by the fact that the 50-period moving average remains below the 200-period moving average.
• Support: 93.14 (S1), 91.22 (S2), 89.32 (S3).
• Resistance: 95.36 (R1), 98.81 (R2), 101.00 (R3).
BENCHMARK CURRENCY RATES - DAILY GAINERS AND LOSERS
MARKETS SUMMARY
- English (UK)
- English (India)
- English (Canada)
- English (Australia)
- English (South Africa)
- English (Philippines)
- English (Nigeria)
- Deutsch
- Español (España)
- Español (México)
- Français
- Italiano
- Nederlands
- Português (Portugal)
- Polski
- Português (Brasil)
- Русский
- Türkçe
- العربية
- Ελληνικά
- Svenska
- Suomi
- עברית
- 日本語
- 한국어
- 简体中文
- 繁體中文
- Bahasa Indonesia
- Bahasa Melayu
- ไทย
- Tiếng Việt
- हिंदी
Euro Stays Firm Despite Dovish Comments From ECB Officials
Published 11/20/2013, 12:48 AM
Updated 07/09/2023, 06:31 AM
Euro Stays Firm Despite Dovish Comments From ECB Officials
Latest comments
Loading next article…
Install Our App
Risk Disclosure: Trading in financial instruments and/or cryptocurrencies involves high risks including the risk of losing some, or all, of your investment amount, and may not be suitable for all investors. Prices of cryptocurrencies are extremely volatile and may be affected by external factors such as financial, regulatory or political events. Trading on margin increases the financial risks.
Before deciding to trade in financial instrument or cryptocurrencies you should be fully informed of the risks and costs associated with trading the financial markets, carefully consider your investment objectives, level of experience, and risk appetite, and seek professional advice where needed.
Fusion Media would like to remind you that the data contained in this website is not necessarily real-time nor accurate. The data and prices on the website are not necessarily provided by any market or exchange, but may be provided by market makers, and so prices may not be accurate and may differ from the actual price at any given market, meaning prices are indicative and not appropriate for trading purposes. Fusion Media and any provider of the data contained in this website will not accept liability for any loss or damage as a result of your trading, or your reliance on the information contained within this website.
It is prohibited to use, store, reproduce, display, modify, transmit or distribute the data contained in this website without the explicit prior written permission of Fusion Media and/or the data provider. All intellectual property rights are reserved by the providers and/or the exchange providing the data contained in this website.
Fusion Media may be compensated by the advertisers that appear on the website, based on your interaction with the advertisements or advertisers.
© 2007-2024 - Fusion Media Limited. All Rights Reserved.