Hourly
On Tuesday the growth of American and European stock markets kept the situation stable on the currency market. The EUR/USD fell to 1.1396. The US indices came out up 2.5%.
They didn’t manage to stay in the black though. In the last hour before the close of the trading session, they slipped into the red. Market participants are concerned that Asia is going to crumble again. After all, the European and American indices grew even with a mixed closing of the Asian indices.
Tuesday saw the Dow Jones Industrial Average down by 204.91 (-1.29%) to 15,666.44 points. The S&P 500 closed down by 25.60 (-1.35%) at 1867.61 points. The NASDAQ Composite closed down by 19.8 (-0.44%) at 4,506.50 points.
Statistics in the US came out positive. Traders didn’t really give them much attention, since China and the stock markets are is still dominating the picture. The euro returned from a minimum to 1.1560.
The US August consumer confidence index stood at 101.5 (forecasted: 91.5, previous: reassessed from 90.9 to 91.0).
July US Construction of new homes was 507,000 (forecasted: 505,000, previous: reassessed from 482,000 to 481,000).
Main news of the day:
At 13:00 EET, the UK is publishing a retail sales report;
At 15:30 EET, the US is releasing order numbers for durable goods;
At 17:00, the FOMC’s William Dudley will give a speech.
Market Expectations:
I think that the market swings will continue throughout Wednesday. There isn’t much news out, so investor attention will still be on stock market movements. The Asian stock indices are trading mixed. A large part of them are now in the positive.
Technical Analysis:
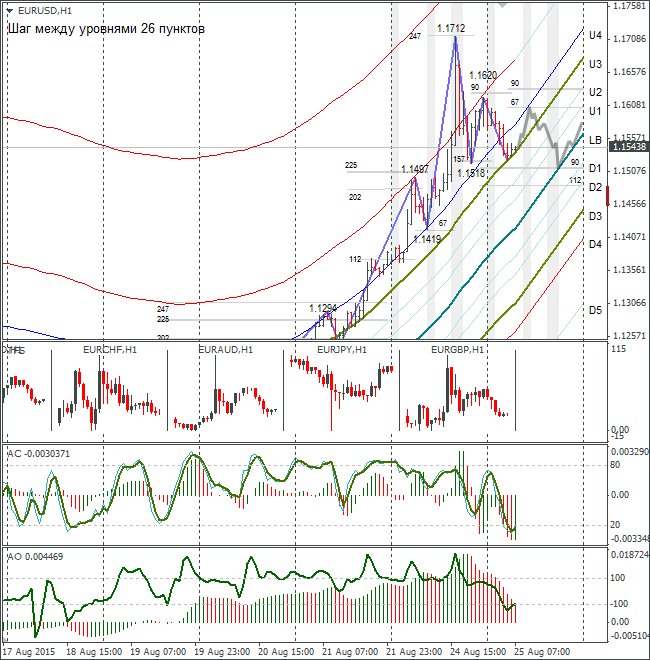
Intraday target: maximum: 1.1580 (Europe: 157 degrees), minimum: 1.1485 (in States: 67 degrees), close: 1.1530;
Intraday volatility for last 10 weeks: 119 points (4 figures).
From the 180th degree, the euro renewed to 135 degrees. The pair is now having a time-out at the balance line. Trades in Asia aren’t making much noise. Taking into account that the stochastic is still loading, in the first half of the day I’m considering a growth for the euro to 1.1580. After the test of 157 degrees I’m expecting a fall to 1.1485.
Daily
Due to European and American stock market indices gaining back ground, the EUR/USD fell below the support to 1.1396. As we see, the bulls managed to take the rate to 1.1560. A long tail is really dangerous as it means the euro’s strengthening could continue if it doesn’t return to the 1.1356 minimum in the next two days. I’ve gone for a flat today since the stock market situation is still uncertain. Now to the Weekly.

Weekly
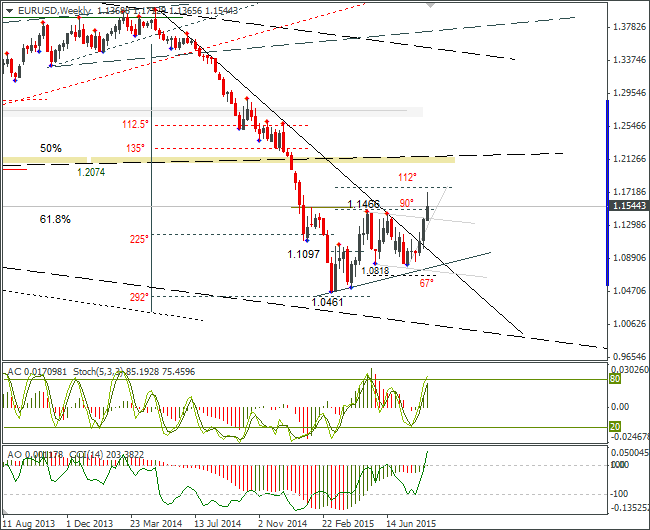
On Tuesday, the EUR/USD fell to 1.1356. Imagine the candle for the week closes around 1.14. This would see a weekly pinbar form. After this the traders will once again look at a fall in the euro to around 1.1050. The target of is 1.1773 is still valid.
