The euro turned weaker on Monday's open after late Sunday coalition talks between Merkel's CSU/CDU and other parties broke down. The uncertainty led to the possibility of snap elections which weighed on the common currency. However, the declines in the euro were seen to be limited. The weakness in the euro managed to send the U.S. dollar to close higher on the day.
The ECB President, Mario Draghi was also seen speaking yesterday. In his testimony to the European Parliament, Draghi defended the ECB's monetary policy actions. He stated that the Euro area economy still required some stimulus in order to recover from the economic slowdown and for inflation to rise.
Looking ahead, the economic calendar today will see the release of the UK's inflation report hearings. In the U.S. the existing home sales data is expected to show an increase of 5.42 million. The Fed Chair, Janet Yellen will be speaking later in the evening.
EUR/USD intra-day analysis

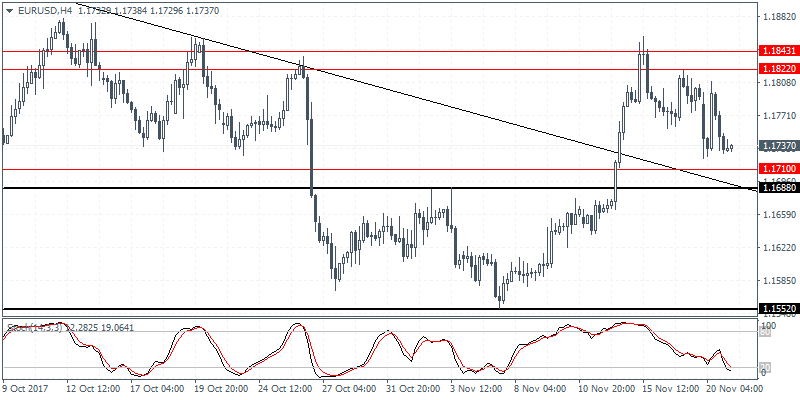
EUR/USD (1.1737):The euro extended declines yesterday, mostly on account of the uncertainty surrounding the German political developments. Price action shows that EUR/USD is likely to extend the declines down to 1.1704 level of support seen on the daily chart. This marks the retest of the breakout from the falling wedge pattern from where price previously broke out from. However, further declines can be expected only on a strong close below this support level. With the trend line offering dynamic support and the horizontal support level confluence, the declines could be limited. EUR/USD is most likely to maintain a sideways range as a result. On the 4-hour chart, the hidden bullish divergence that is developing adds weight to the limited downside in price.
USD/JPY intra-day analysis

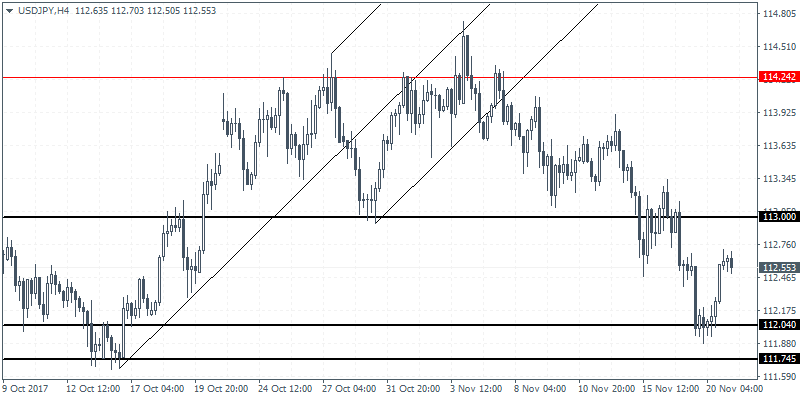
USD/JPY (112.55):USD/JPY attempted to post a pullback following the declines from Friday. This came amid a bounce off the support level seen at 112.04. USD/JPY is expected to remain range bound within the 113.00 and 112.04 levels of resistance and support. Any short-term gains are likely to be limited to the 113.00 resistance level. A reversal here could however increase the odds of a decline with a potential breach of the support level at 112.04. Below this support, USD/JPY could be seen pushing lower towards the 110.70 support level. This will mark the downside move following the breakout from the rising wedge pattern on the daily chart.
XAU/USD intra-day analysis

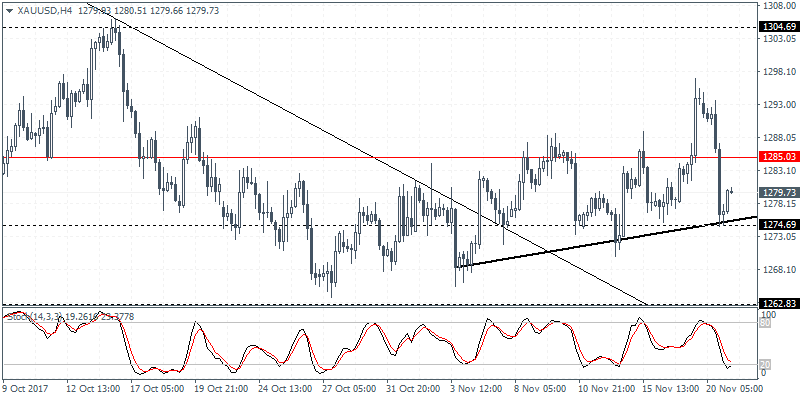
XAU/USD (1279.73):Gold prices gave up the gains following the fake break out above 1285 level. Price action failed to hold on the gains as the resistance level of 1285 failed as support. The decline to 1274.70 region puts gold prices back into a sideways range. Support at 1274.70 came due to the confluence between the rising trend line and the horizontal support. Further declines can be seen on a break down below this level of support. This could put gold prices at risk of a decline towards the 1262.00 level of support.
