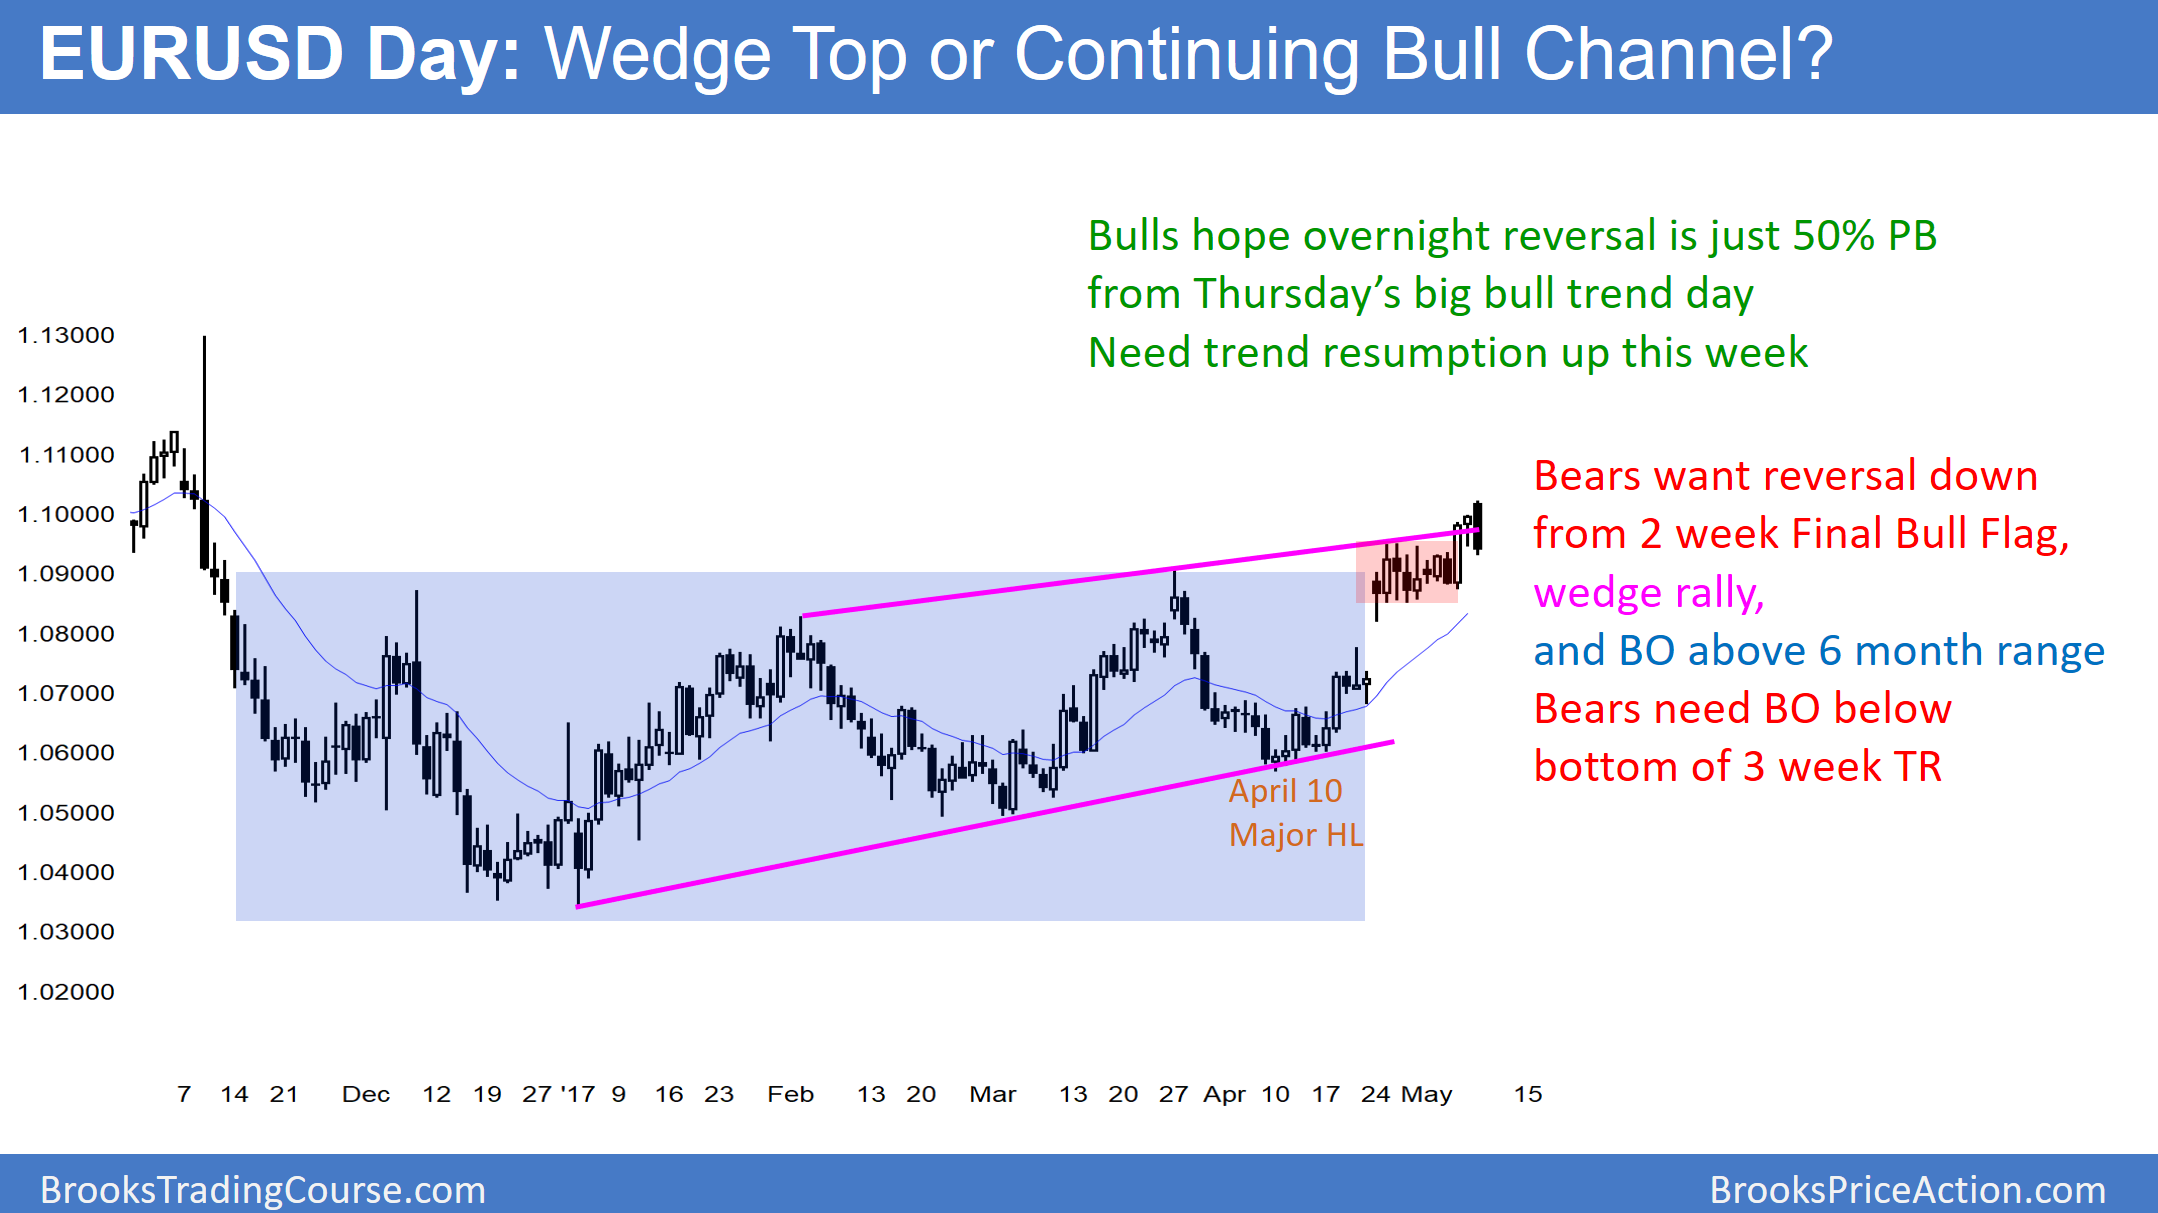
The EUR/USD daily Forex chart has been in a broad bull channel for 5 months. Since the channel is a wedge and within a 2 year trading range, the bull breakout above the 5 month trading range will probably fail.
The EUR/USD daily Forex chart rallied from a 15 year low in January. Yet, because it is still in a 2 year trading range, I have been writing all year that the odds are every strong rally and selloff will reverse. Consequently, every strong move is likely simply a leg in the range and not the start of a trend.
Fundamentals are useless to traders
The daily chart broke out last week above a 2 week trading range.
I said that it would probably rally to about a measured move up and then reverse. Macron’s victory last night is theoretically bullish for Europe. Yet, the EUR/USD Forex market sold off. How can that happen? It is because the market is trading more technically than fundamentally. It is range bound. There it is constantly probing for the extremes of the range.
Traders expected Macron to win and bid the market up. Yet, they are now deciding that they probably priced it too high. Furthermore, they are correctly thinking that it is just one tiny piece of fundamental information in a market with thousands of other pieces. They are therefore immediately discounting it and looking ahead to the next piece of information.
Each piece can seem extremely important in the weeks leading up to the news. Yet, when traders step back and look at the monthly chart, everything that seems important today is meaningless compared to the 500 days in the monthly trading range.
Overnight EUR/USD Forex trading
The EUR/USD bulls have achieved their minimum objective of a breakout above the 2 week trading range. Many are therefore taking profits, and bears are beginning to sell. Hence, what happens over the next few days affects what will happen over the next month.
The bears want follow-through selling after last night’s reversal down. They want the reversal to continue far below the 3 week trading range and at least 50 pips back into the November to April trading range. If they succeed, they would then expect at least a 50% pullback from the month long rally, and possibly a test of the April 10 major higher low.
The bulls know that their 3 week breakout above the 5 months range has been week. They hope that the overnight selloff is just a sharp 50% pullback from Thursday’s strong rally. Hence, they need the selloff to reverse back up this week. If they are successful and get a strong breakout above last week’s high, which is unlikely, they will next try to get above the
November 9 top of the huge bear reversal.
Last night’s big reversal down after Thursday’s big rally creates a Big Up, Big Down pattern. This means Big Confusion and hence a likely trading range for today. The EUR/USD has been sideways for 4 hours and it will probably continue sideways for most of the day. Yet, its direction over the next week will probably determine what it will do for the next month. The odds favor a continuation of the 5 month and 2 year trading ranges.

