
EUR/USD: European Session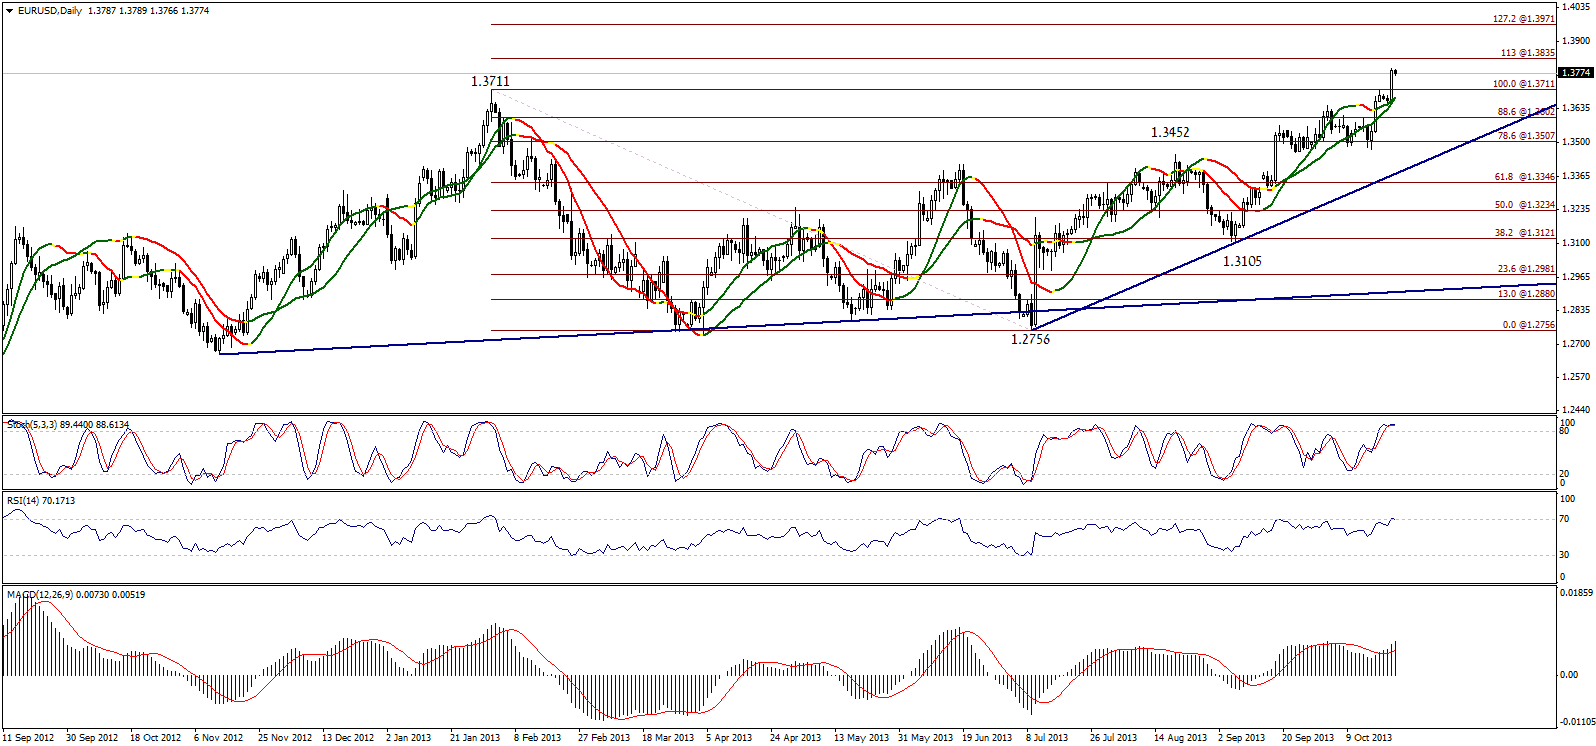 EUR/USD Daily Chart" title="EUR/USD Daily Chart" width="635" height="113">
The pair moved sharply to the upside yesterday and stabilized above 1.3710 which is now a trend interval. Stability above 1.3710 will extend the upside move to test 113% correction around 1.3835 showing on graph and perhaps 127.2% at 1.3970. A breakout below 1.3685 will make us reconsider our intraday positive expectations today.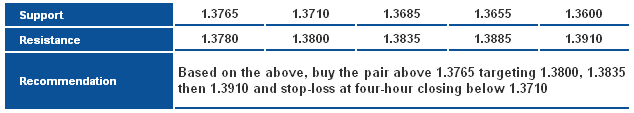 EUR/USD S&R" title="EUR/USD S&R" width="636" height="113">
GBP/USD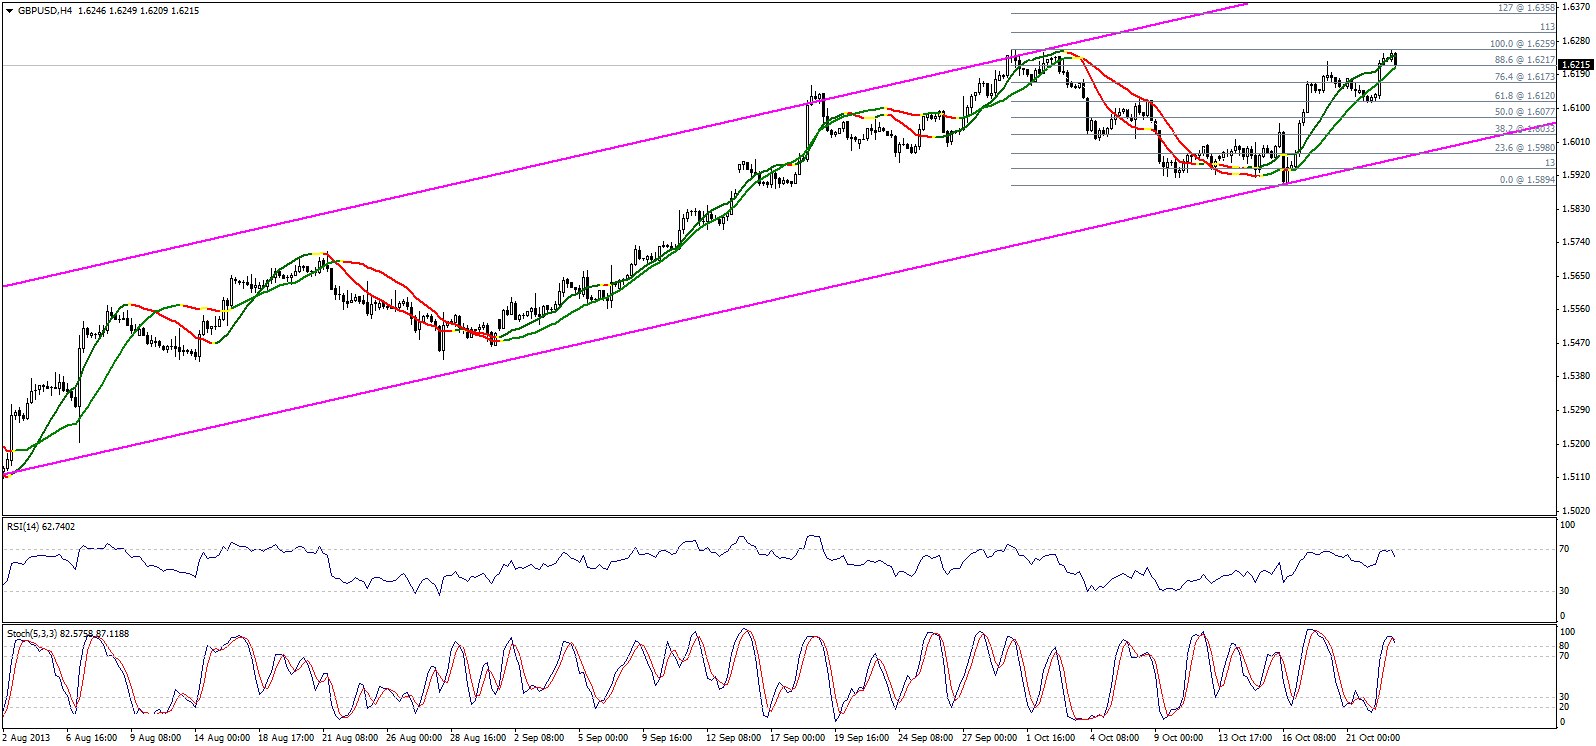 GBP/USD Hourly Chart" title="GBP/USD Hourly Chart" width="636" height="113">
The pair touched 1.6260 yesterday -the previous recorded top- then moved to the downside after the sharp bullishness. Failing to trade above the referred to level is negative forcing the pair to respond to the negative signals on momentum indicators. Meanwhile, we cannot bet on the downside move in light of positivity on Linear Regression Indicators, therefore we remain neutral for now. 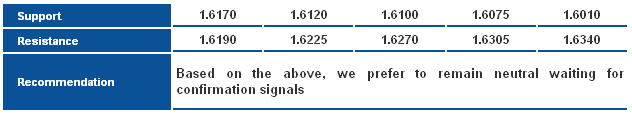 GBP/USD S&R" title="GBP/USD S&R" width="636" height="113">
USD/JPY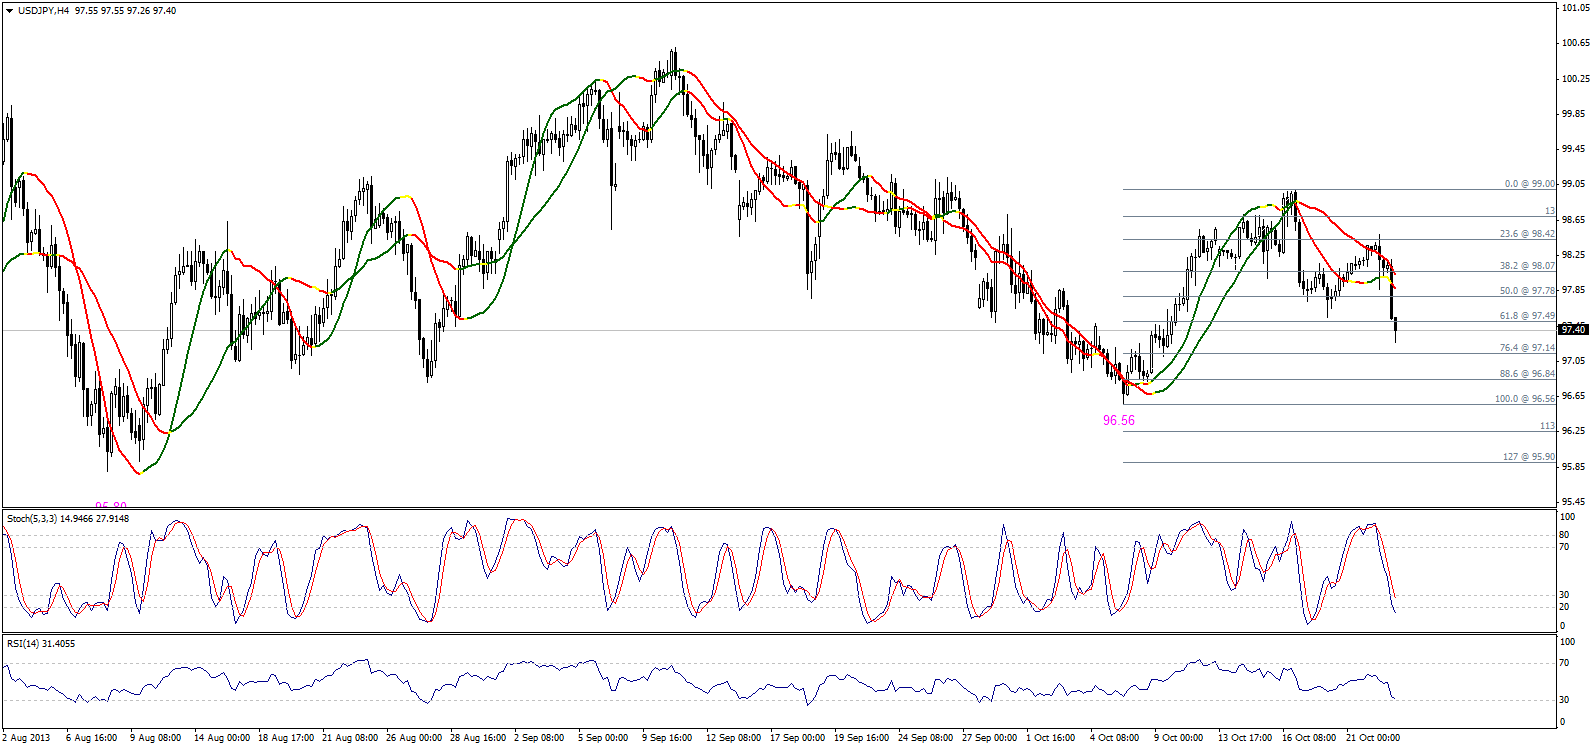 USD/JPY Hourly Chart" title="USD/JPY Hourly Chart" width="636" height="113">
The pair dropped sharply and is currently trading below 97.60 levels and below 61.8% correction at 97.50. Stability below the referred to level might extend the downside move towards 97.10 and perhaps 96.85 represented in 76.4% and 88.6% respectively. Breaching 98.10 might cancel the negative expectations.
**The trading range for today is among key support at 96.55 and key resistance at 98.40.
**The general trend over short term basis is to the downside as far as areas of 103.50 remain intact targeting 93.50.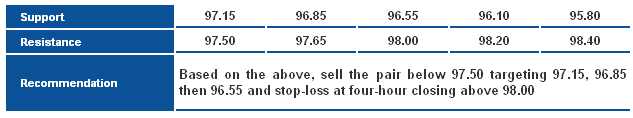 USD/JPY S&R" title="USD/JPY S&R" width="636" height="113">
USD/CHF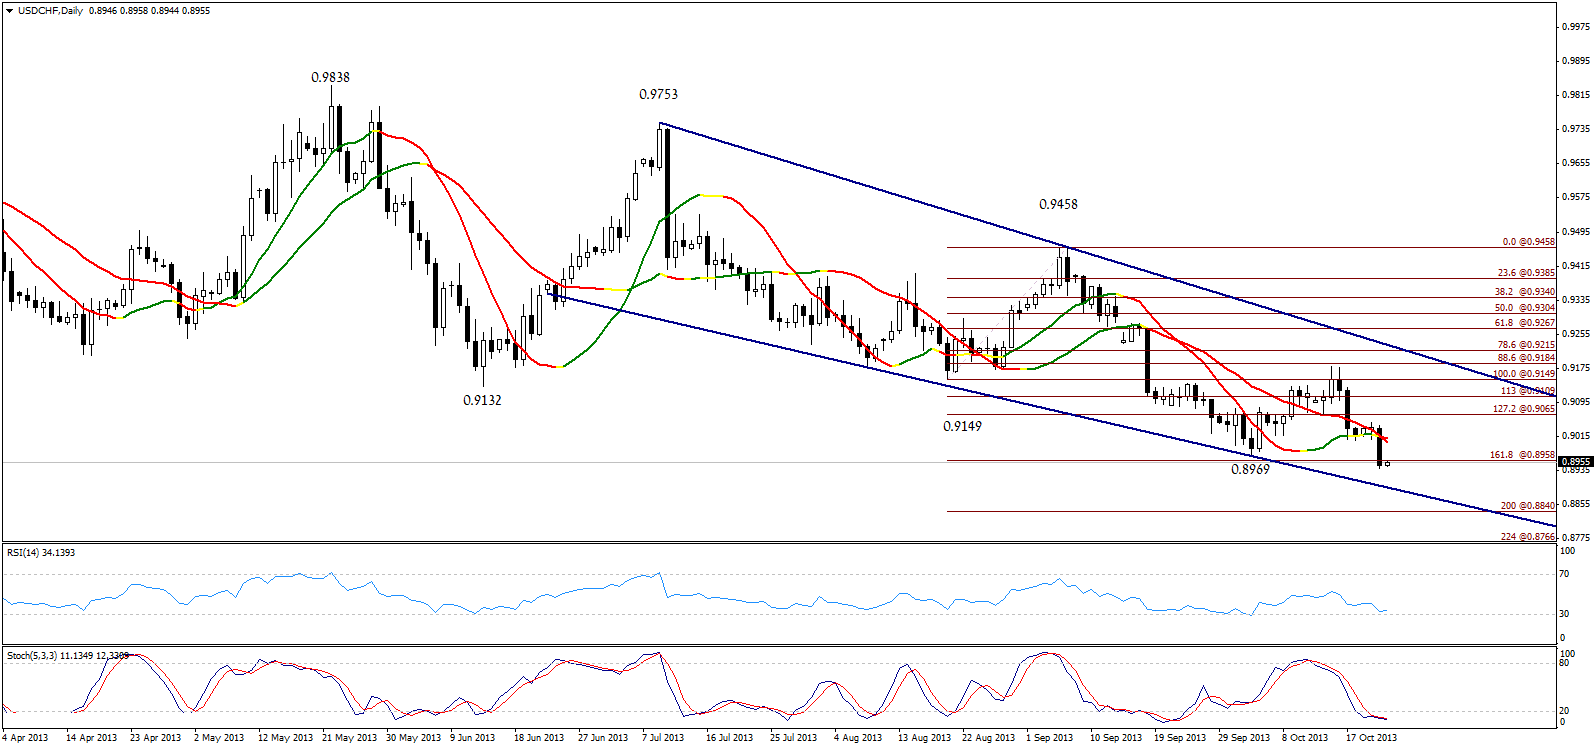 USD/CHF Daily Chart" title="USD/CHF Daily Chart" width="636" height="113">
The pair moved to the downside yesterday and is stable below 161.8% Fibonacci at 0.8960 today. Stability below the referred to level is negative and might extend bearishness today reaching 0.8840 levels. Breaching 0.9065 could fail these expectations, but we prefer stabilizing below 0.9000 levels to keep these expectations strong.
**The trading range for today is among key support at 0.8840 and key resistance at 0.9065.
**The general trend over short term basis is to the downside targeting 0.8860 as far as 0.9775 remains intact.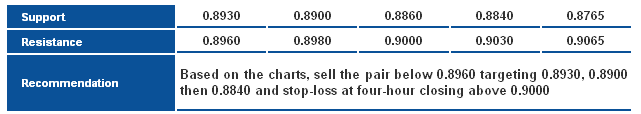 USD/CHF S&R" title="USD/CHF S&R" width="636" height="113">
USD/CAD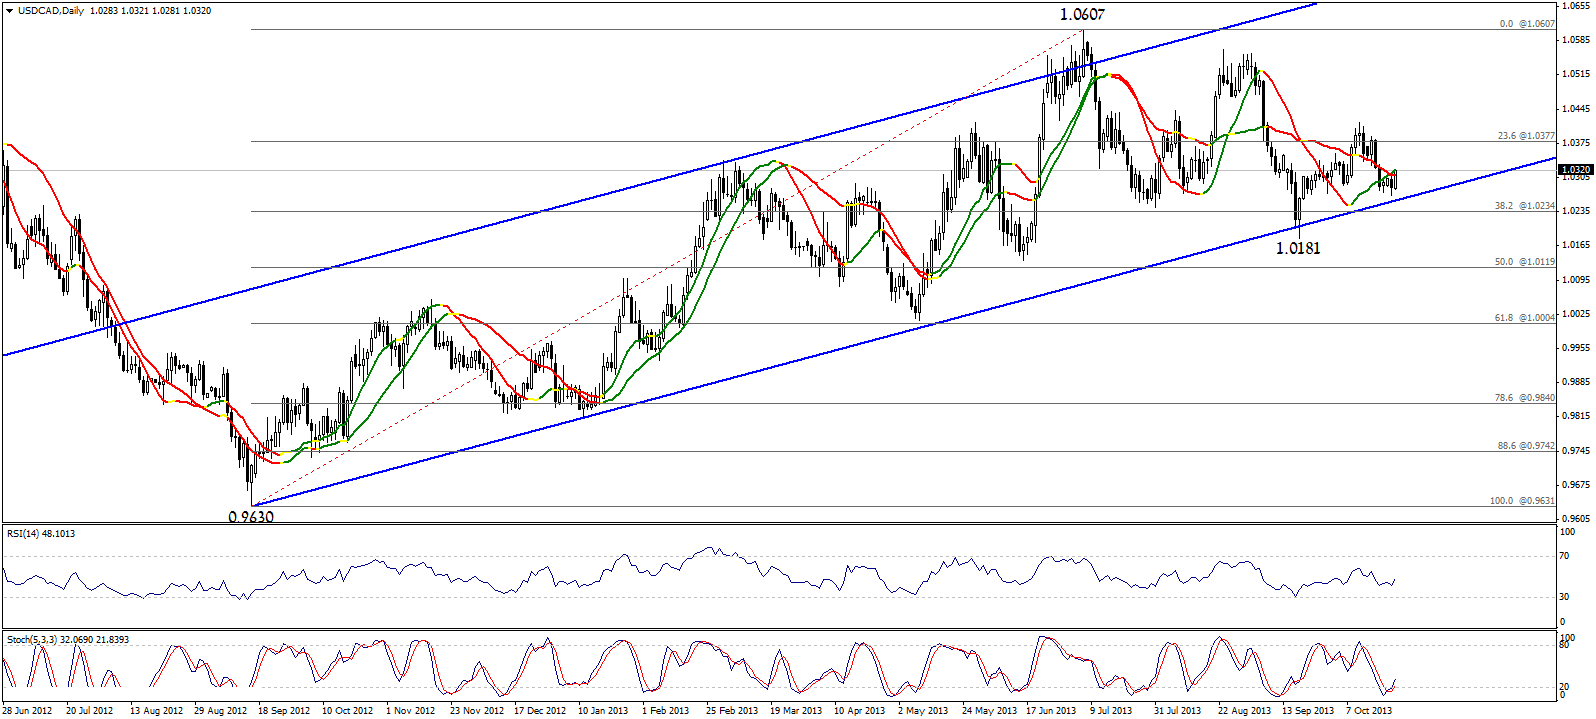 USD/CAD Daily" title="USD/CAD Daily" width="636" height="113">
The pair moved to the upside today after halting the bearish wave above the key support level of the ascending channel shown on graph. Trading above 1.0270 levels is intraday positive that remains valid unless levels 1.235 were broken.
**The trading range for today is between the key support at 1.0235 and the key resistance at 1.0455.
**The general trend over short term basis is to the upside with steady daily closing above 1.0100 targeting 1.0775.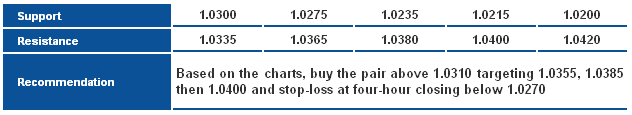 USD/CAD S&R" title="USD/CAD S&R" width="636" height="113">
AUD/USD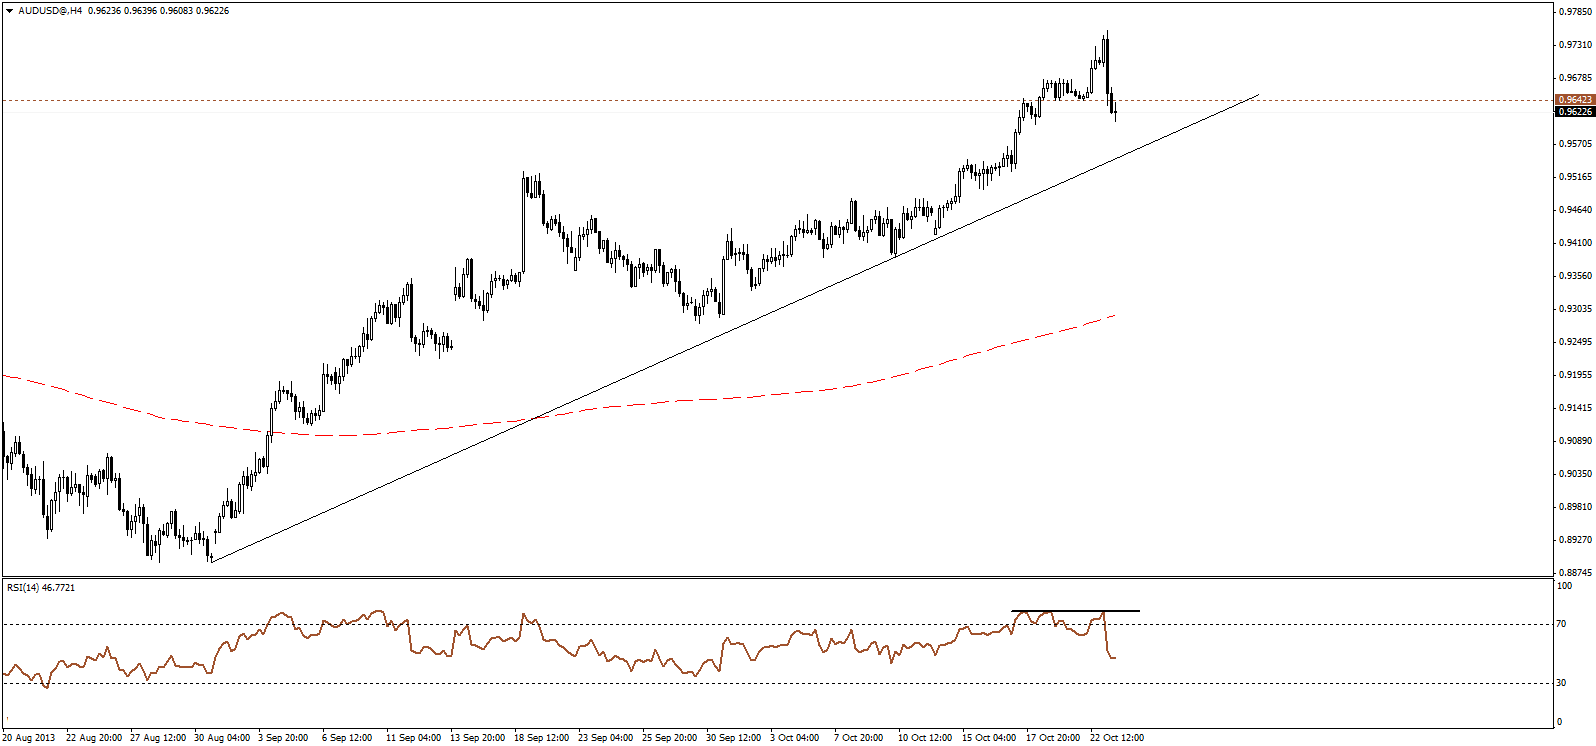 AUD/USD Hourly Chart" title="AUD/USD Hourly Chart" width="636" height="113">
The pair extended the decline, breaking below 0.9640 support level, and thus indicating further downside. A retest of 0.9640 broken support-turned-resistance may provide another opportunity to short the pair.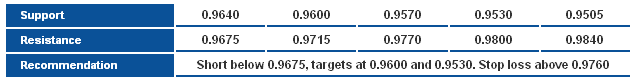 AUD/USD S&R" title="AUD/USD S&R" width="636" height="113">
NZD/USD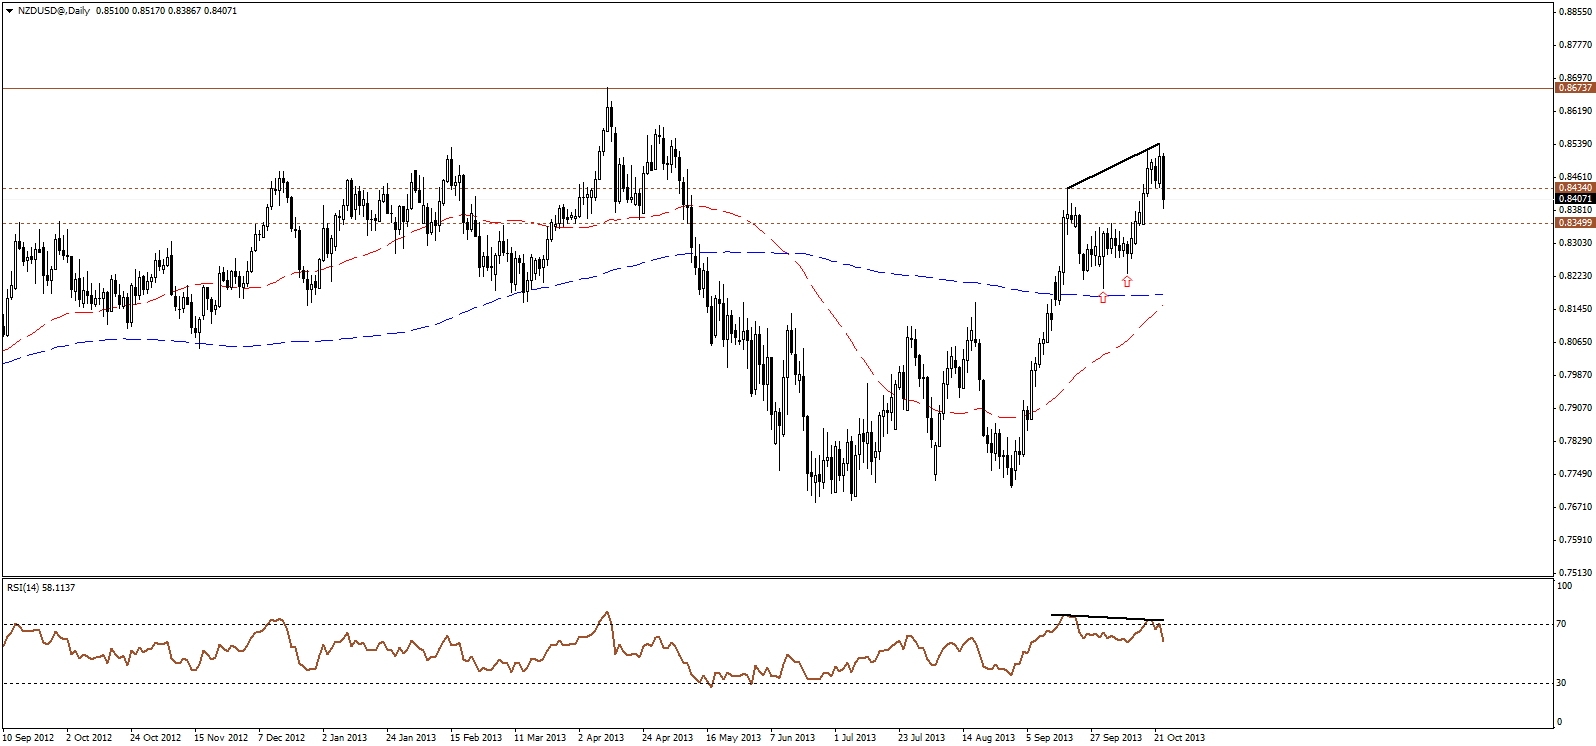 NZD/USD Daily Chart" title="NZD/USD Daily Chart" width="636" height="113">
The price reverses sharply, breaking back below 0.8435 support level, while RSI remains bearishly divergent, the sharp selloff and stability below 0.8345 indicates further downside.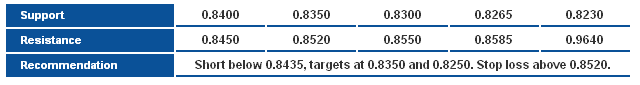 NZD/USD S&R" title="NZD/USD S&R" width="636" height="113">