EUR/USD - Weekly Report
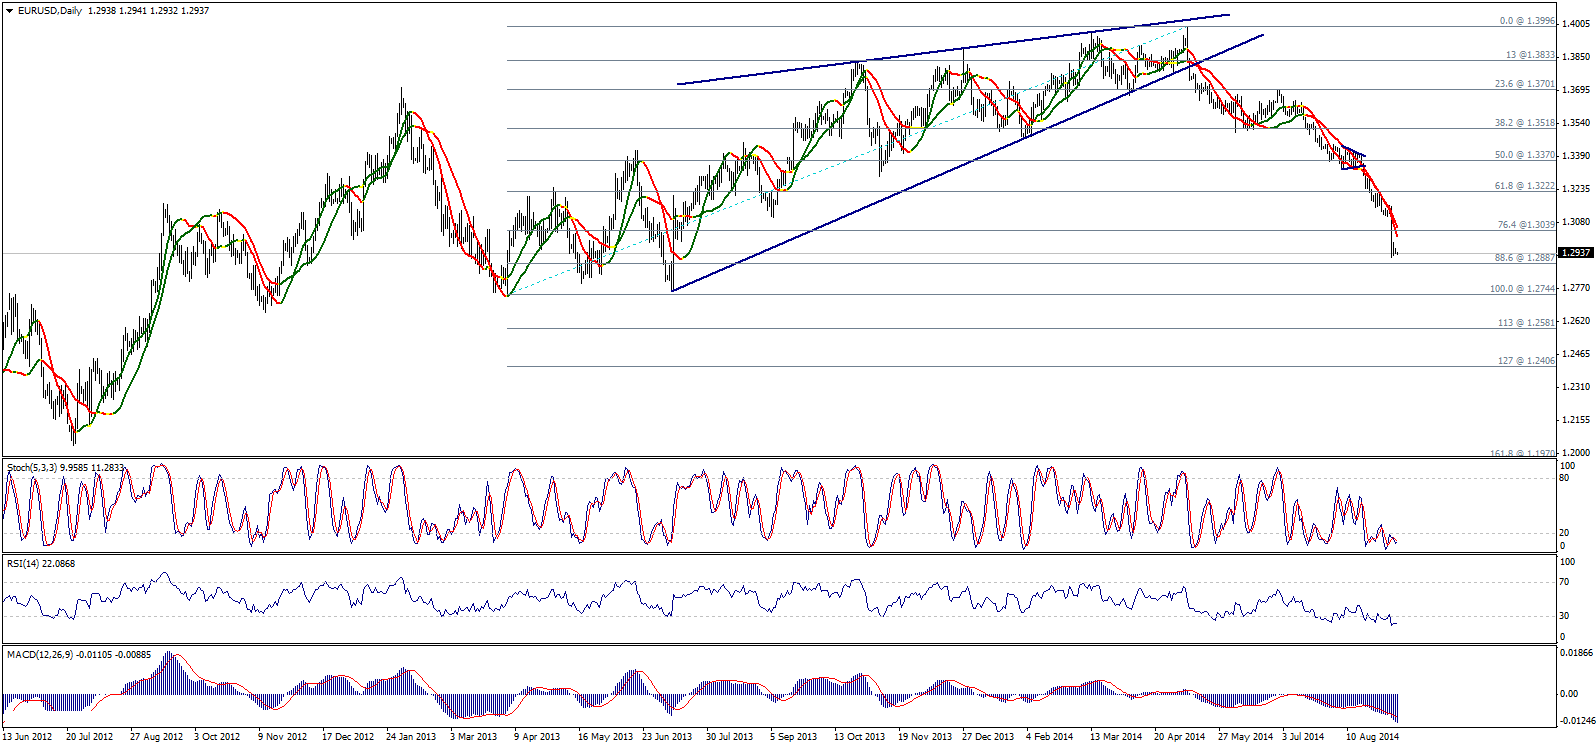
The pair dropped sharply last week and is approaching 88.6% correction at 1.2885 this week as showing on graph. The referred to level would be the interval intraday and this week and breaking it could extend the downside move to test the previous bottom at 1.2744 and perhaps 113% correction at 1.2580.
Negative expectations require stability below 76.4% correction at 1.3040, whereas stabilizing below it is required to keep the bearish possibility valid. Of note, Linear Regression Indicator 34 broke 76.4% correction supporting the possibility of extending the downside move.

GBP/USD - Weekly Report
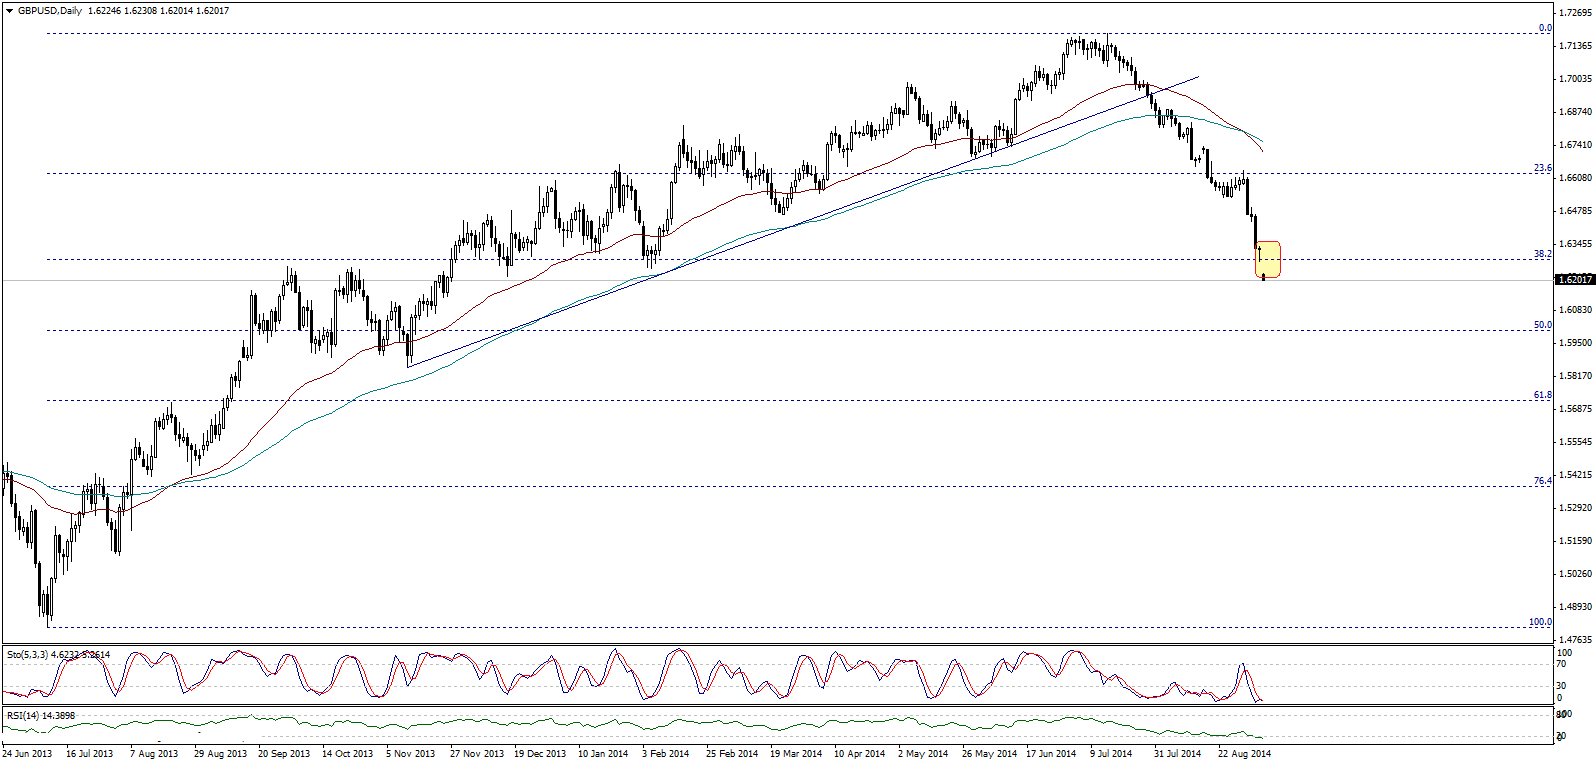
The pair broke 1.6285 sharply today indicating that the downside move will continue in the upcoming period, as the next target resides at the psychological barrier 1.6000. Therefore, the bearish bias remains favored by stabilizing below 1.6285, whereas breaching this level support the attempts of bringing the pair back to the upside.

USD/JPY - Technical Report
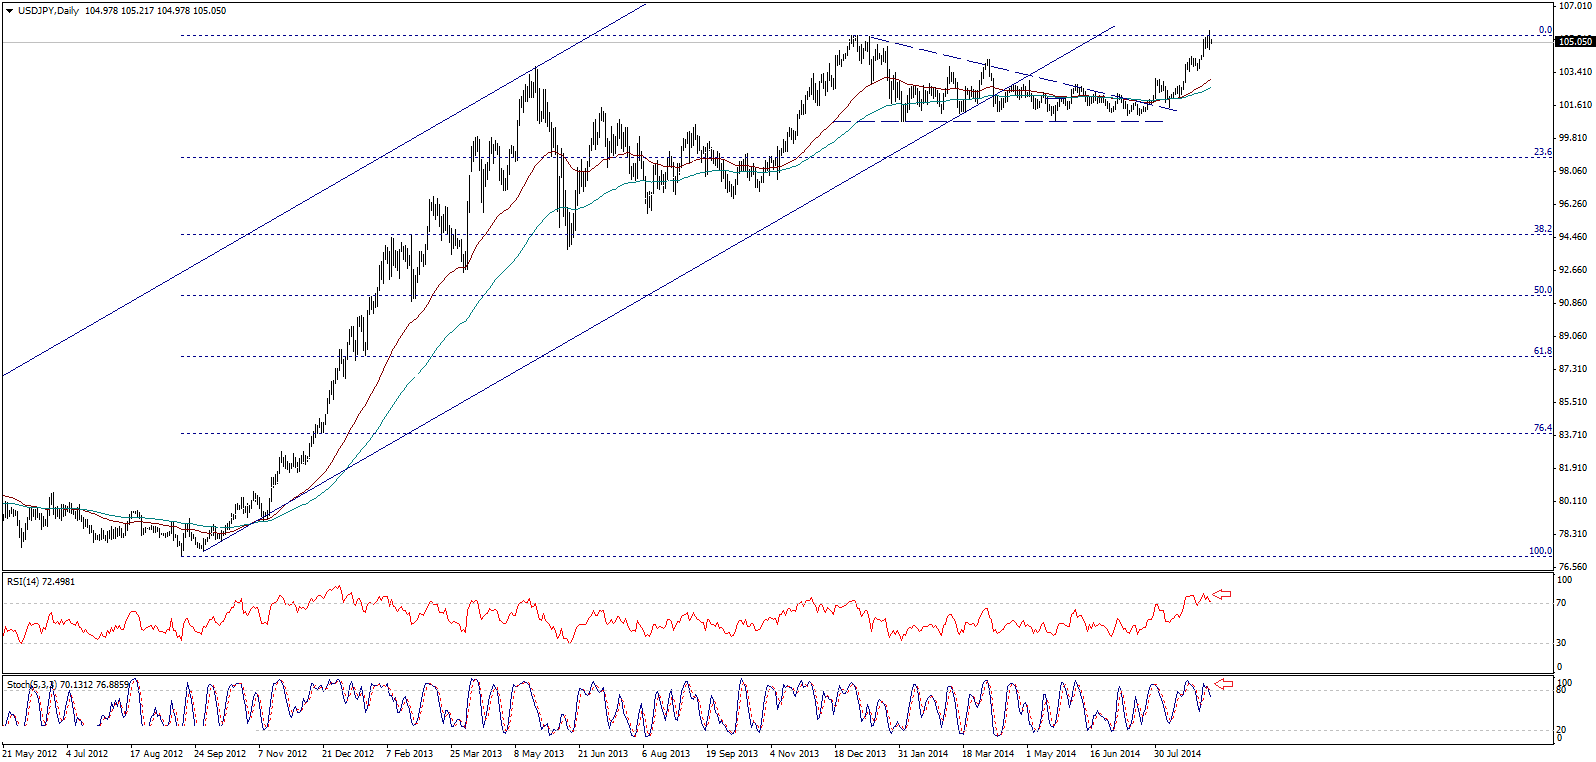
The pair is still fluctuating close to the previously recorded top 105.43 and is stable below it, while momentum indicators are providing negative signals on the daily graph keeping the opportunities of negative trading valid waiting to move towards 103.05. A break below the referred to level extends bearishness towards 100.75, while breaking 105.43 pushes the pair to trade positively and the next targets reside at 107.00.

USD/CHF - Technical Report
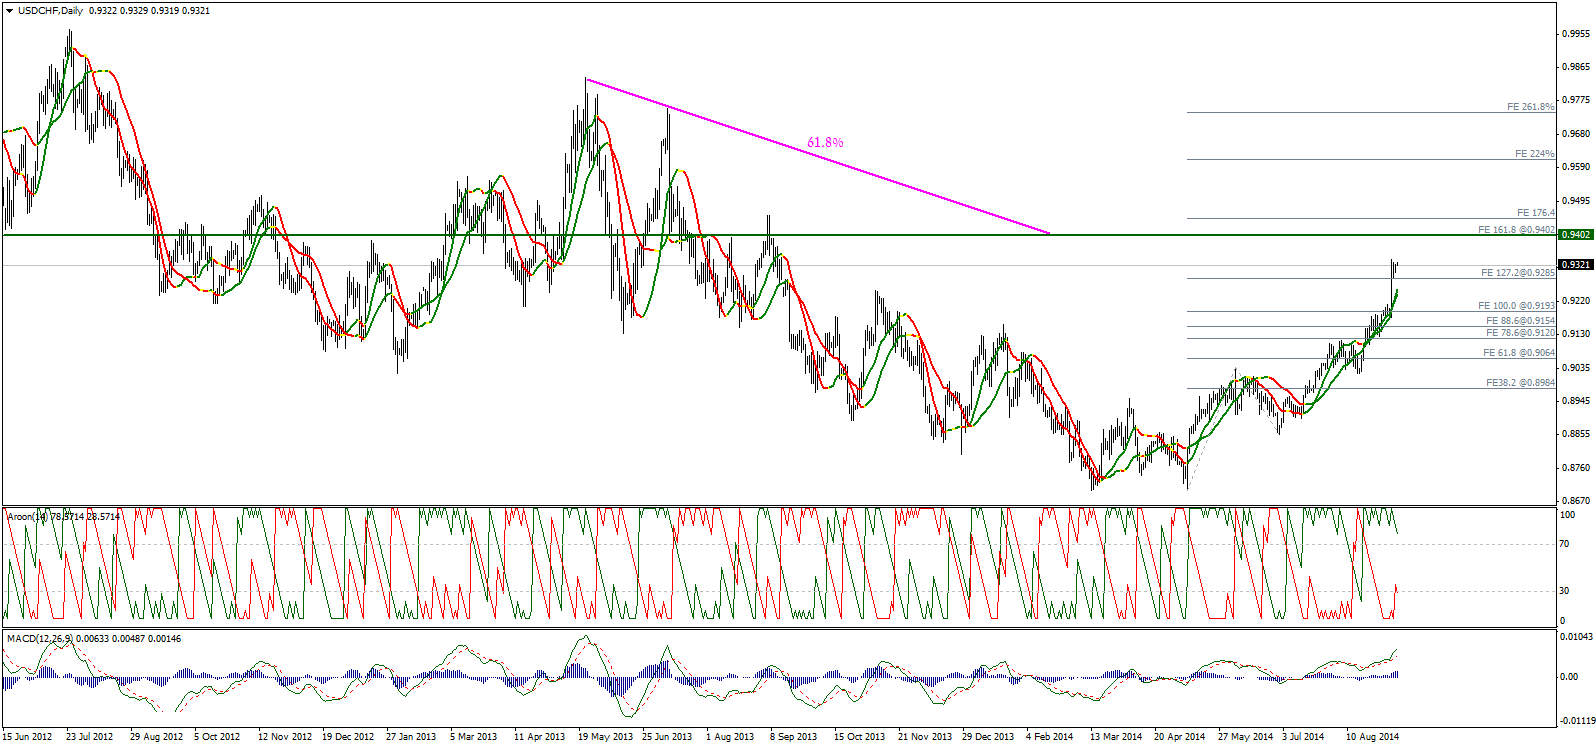
The pair continued moving to the upside last week and breached 0.9285. Stability above the referred to level favors extending the upside move to test 0.9405 at 161.8% correction showing on graph, in addition to being 61.8% correction of the bearish wave that started from the top 0.9838 reaching the bottom 0.8699.
The intraday upside move require stability above 0.9285, but its significant to breach 0.9405 and stabilize above it to confirm extending the upside move further, as failing to stabilize above it fails the bullish wave and activates a bearish correction.

USD/CAD - Technical Report
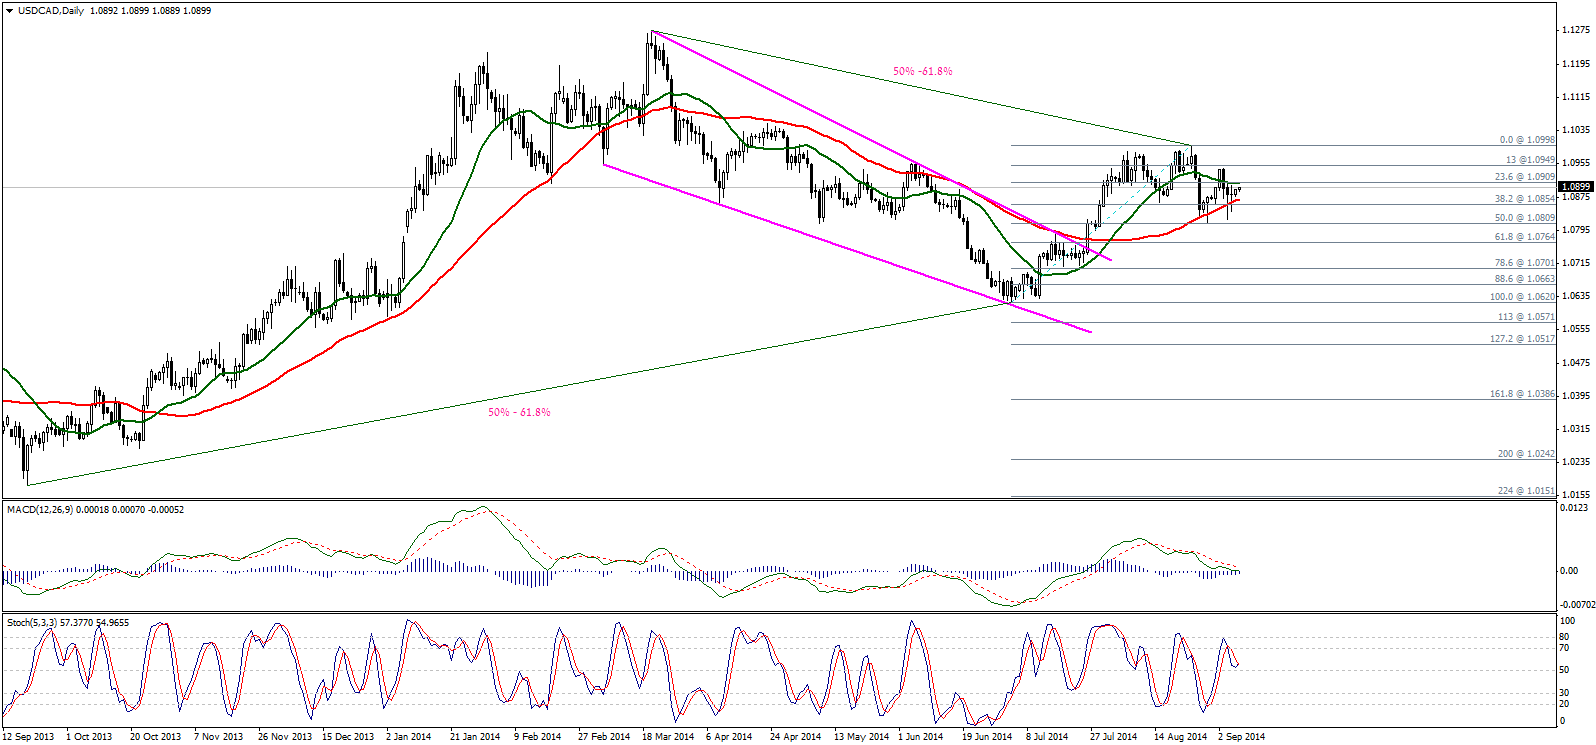
USD/CAD was stuck between SMA 20 and 50 as showing on graph. Stochastic also failed to break line 50 and began to rebound to the upside. But on the other hand, MACD is moving in a downside move.
The technical catalysts are mixed, but after the frequent failure in stabilizing above 1.1000, we can bet on a downside move for the upcoming period unless the pair breached the referred to level. From the downside, a break below 1.0805 indicates the possibility of extending the downside move.

AUD/USD - Weekly Report
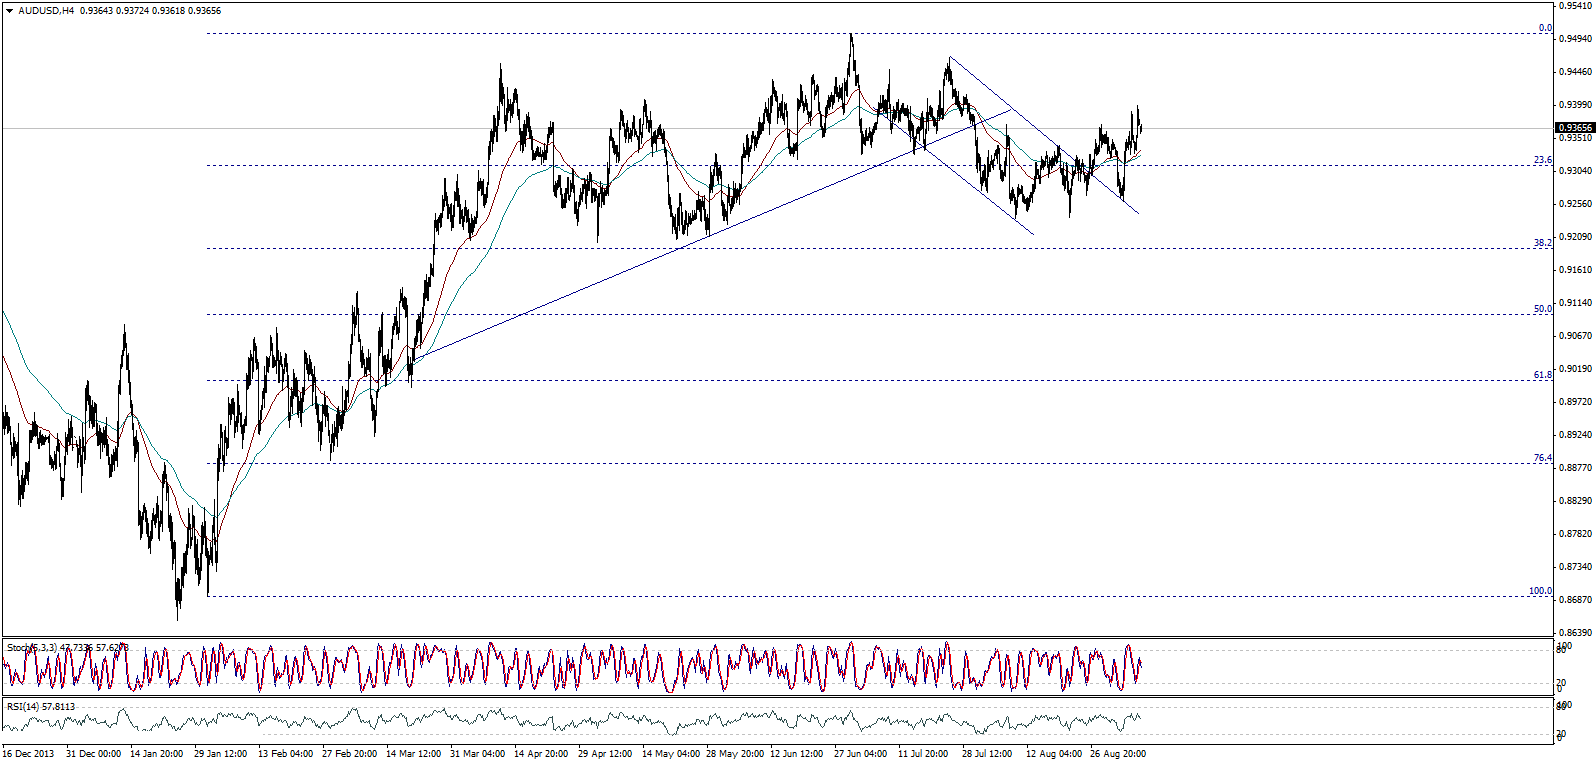
AUD/USD pair ended last week's trading above 0.9310 forming a significant positive catalyst that support extending the bullish expectations supported by SMA 50 and 100, and the next main target resides at 0.9500. The pair needs further positive momentum that support extending the upside move and remains valid unless the pair breaks 0.9250 and stabilize below it.

NZD/USD - Technical Report
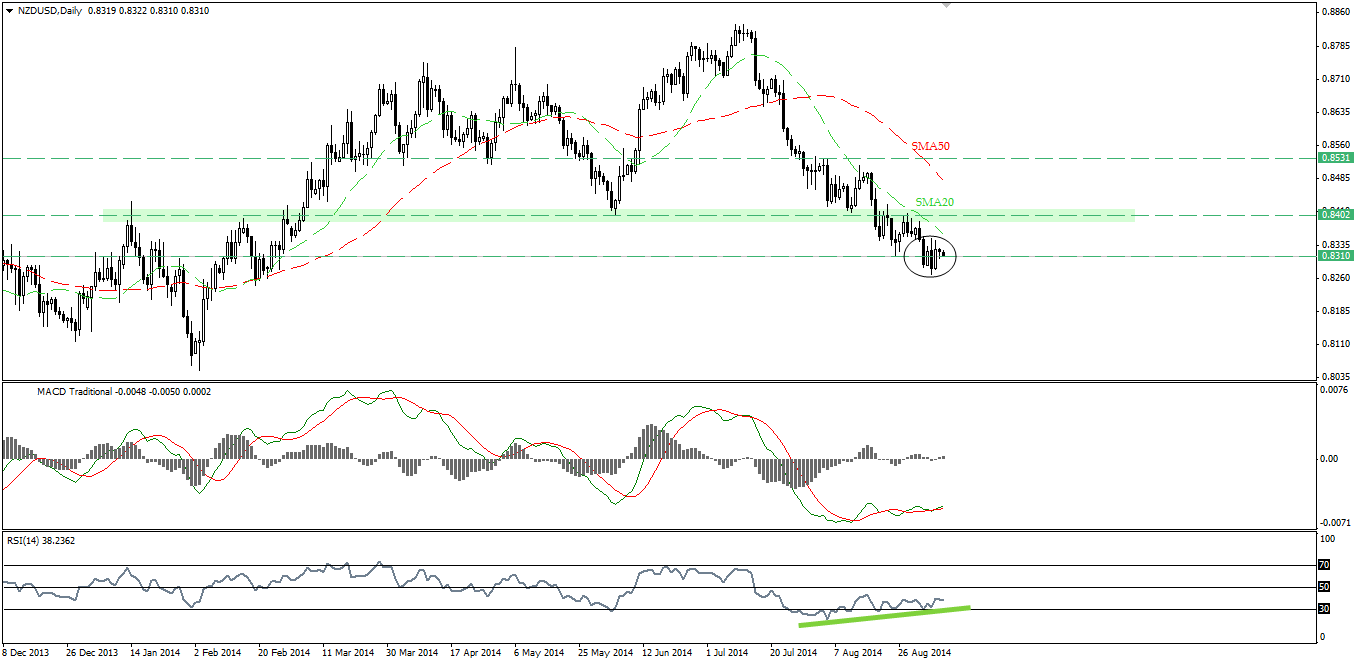
The technical hesitation persists on NZD/USD pair over daily studies due to the contrarian between stability below moving averages and the bullish tendencies appearing on RSI14, which aims to draw a positive divergence. Actually, resuming the main downtrend depends on breaching 0.8260, while achieving considerable recovery depend on the price behaviors around 0.8350. Anyway, neutrality remains in favor this week until the pair shows an actionable setup to define the next big move.

