
EUR/USD is still caught between two lines forming a mid-term rising wedge (red lines). We mentioned this formation yesterday and on Tuesday, sellers really took advantage of this formation and its upper resistance, just below 50% Fibonacci retracement. That was the point where the downswing really started.
Buyers spent all morning trying to break the 1.3130 level but all attempts were unsuccessful. A crucial moment for EUR/USD is marked with a white rectangle. The first 15 minutes candle represents the last failed attack on 1.3130 and forms a shooting star. The second one is a hangman, bearish candle indicating troubles with the upper movement and the last one is a long red candle indicating sellers’ advantage. A combination of those three candles forced technical traders to sell EUR and allowed them to break two major supports on 1.3105 and 1.3090 which are now the most current resistances.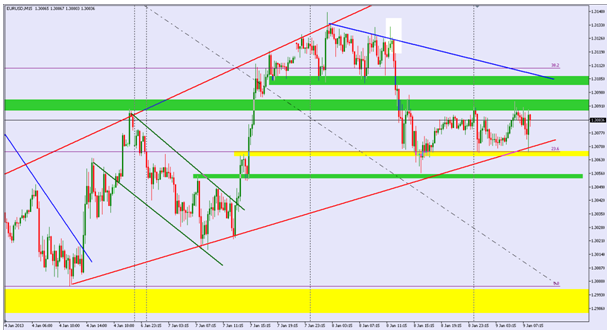 EUR/USD" title="EUR/USD" width="609" height="334">
Wednesday started with a rectangle closed between 1.3065 and 1.3090 and those will be the closest S/R levels at the start of the European session. The price is getting closer to the rising wedge’s lower line (red) and traders should watch that line very carefully as breaking it can cause a major downfall to the 1.30 level. Buy signals will be generated once bulls will break the blue line connecting recent tops which should correlate with the 1.3105 resistance.
- English (UK)
- English (India)
- English (Canada)
- English (Australia)
- English (South Africa)
- English (Philippines)
- English (Nigeria)
- Deutsch
- Español (España)
- Español (México)
- Français
- Italiano
- Nederlands
- Português (Portugal)
- Polski
- Português (Brasil)
- Русский
- Türkçe
- العربية
- Ελληνικά
- Svenska
- Suomi
- עברית
- 日本語
- 한국어
- 简体中文
- 繁體中文
- Bahasa Indonesia
- Bahasa Melayu
- ไทย
- Tiếng Việt
- हिंदी
EUR/USD Continues Its Movement Inside Bearish Rising Wedge
Published 01/09/2013, 06:09 AM
Updated 01/31/2022, 02:45 AM
EUR/USD Continues Its Movement Inside Bearish Rising Wedge
Latest comments
Loading next article…
Install Our App
Risk Disclosure: Trading in financial instruments and/or cryptocurrencies involves high risks including the risk of losing some, or all, of your investment amount, and may not be suitable for all investors. Prices of cryptocurrencies are extremely volatile and may be affected by external factors such as financial, regulatory or political events. Trading on margin increases the financial risks.
Before deciding to trade in financial instrument or cryptocurrencies you should be fully informed of the risks and costs associated with trading the financial markets, carefully consider your investment objectives, level of experience, and risk appetite, and seek professional advice where needed.
Fusion Media would like to remind you that the data contained in this website is not necessarily real-time nor accurate. The data and prices on the website are not necessarily provided by any market or exchange, but may be provided by market makers, and so prices may not be accurate and may differ from the actual price at any given market, meaning prices are indicative and not appropriate for trading purposes. Fusion Media and any provider of the data contained in this website will not accept liability for any loss or damage as a result of your trading, or your reliance on the information contained within this website.
It is prohibited to use, store, reproduce, display, modify, transmit or distribute the data contained in this website without the explicit prior written permission of Fusion Media and/or the data provider. All intellectual property rights are reserved by the providers and/or the exchange providing the data contained in this website.
Fusion Media may be compensated by the advertisers that appear on the website, based on your interaction with the advertisements or advertisers.
© 2007-2024 - Fusion Media Limited. All Rights Reserved.