Sometimes It’s Not Really Worth Waiting For
The recent FOMC Minutes were much awaited, particularly after several FOMC members had given rather tantalizing speeches in the past few days in which they made provocative comments about the need for tightening, how the Fed should go about raising rates, and other topics of great concern to the market. Nonetheless the fact did not equal the anticipation. There was little change in views evident in the minutes – the phrase “had not changed materially since the March meeting” appeared several times – and while they said they “discussed a wide range of topics related to policy normalization,” the only action they decided on was to request additional analysis from the staff. The “how” of policy normalization is getting as much attention as the “when” or “why” as they heard a staff presentation on various new techniques for operating in the money markets. There were no concerns about inflation; “most participants” saw it returning gradually to the Fed’s 2% target, while “a few others” were concerned it would take even longer. Thus they concluded that at the moment there is no trade-off between pursuing their inflation or employment mandates; further stimulus can help them to achieve both. This is not the hawkish view I expected after hearing some of the Fed members speaking recently, but neither was it a departure from previous Fed statements. With no new information, there was no impetus to trading, and interest rates were barely changed: Fed Funds expectations were unmoved and both five- and ten-year yields were up around 2 bps or less, a marginal move.
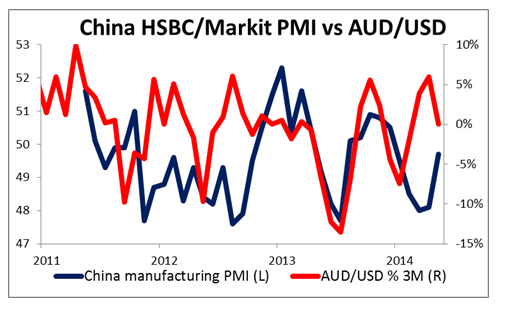
There was more action after the US close when the May HSBC/Markit manufacturing PMI for China rose sharply to 49.7 from 48.1, beating expectations of a much smaller gain to 48.3 and nearly regaining the key 50 level. The report showed both output and orders rebounding, which encouraged optimism that Chinese demand will stabilize. AUD and NZD both gained on the news, with AUD outpacing NZD. I don’t believe that the situation in China will turn around so quickly and so I would not like to chase this rally, on the contrary I think it could provide a good opportunity for people looking to go short. However the currencies could maintain their momentum for the moment.
The European day continues with the preliminary manufacturing and service-sector PMIs for the same month from France, Germany and the Eurozone as a whole. The majority of the indices are forecast to have declined, something that could proof EUR-negative.
The second estimate of the UK GDP for Q1 is also coming out. The forecast is the same as the initial estimate at +0.8% qoq.
The US data is forecast to be largely better. The preliminary Markit manufacturing PMI is forecast to have risen slightly. Initial jobless claims for the week ended on May 17 are forecast to have risen to 310k from 297k. Nonetheless, the 4wk moving average will continue falling to 318k from 323k. US Existing Home sales are expected at 4.7mn in April, up from 4.6mn. On the other hand, the Chicago Fed national activity index is estimated to have declined. The contrast between this group of largely improving indicators and the disappointing Eurozone data may help to keep the USD rally going.
Elsewhere, in Norway, the AKU unemployment rate is forecast to have remained unchanged, while Canada’s retail sales for March are expected to have slowed, which may add to the CAD’s recent problems.
Two speakers are on Thursday’s schedule. ECB Governing Council member and Bank of Spain Governor Luis Maria Linde speaks in Madrid and San Francisco Fed President John Williams will deliver the keynote speech at a conference.
The Market
EUR/USD: Bears Are Back
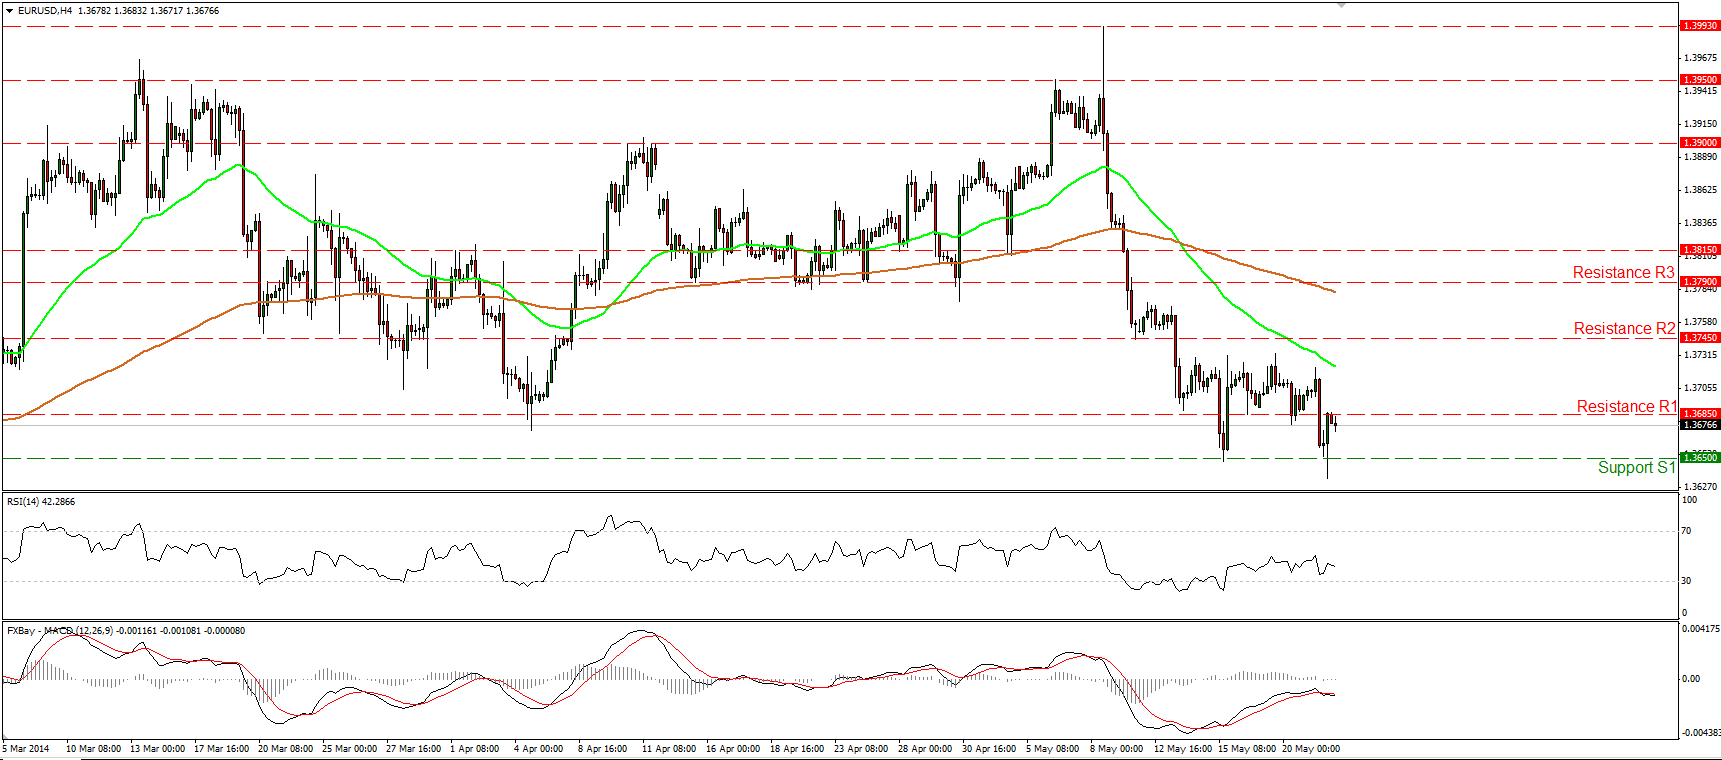
The EUR/USD fell sharply on Wednesday, reaching once again the support barrier of 1.3650 (S1). Near that zone, the pair found some buy orders and rebounded somewhat to meet resistance at 1.3685 (R1). As long as the pair is trading below both the moving averages, the short-term bias remains to the downside and a clear dip below the hurdle of 1.3650 (S1) could see the next one at 1.3600 (S2). The MACD turned down and, already in its bearish territory, poked its nose below its signal line, confirming yesterday’s bearish sentiment.
• Support: 1.3650 (S1), 1.3600 (S2), 1.3475(S3).
• Resistance: 1.3685 (R1), 1.3745 (R2), 1.3790 (R3).
USD/JPY: Rebounds From 100.80
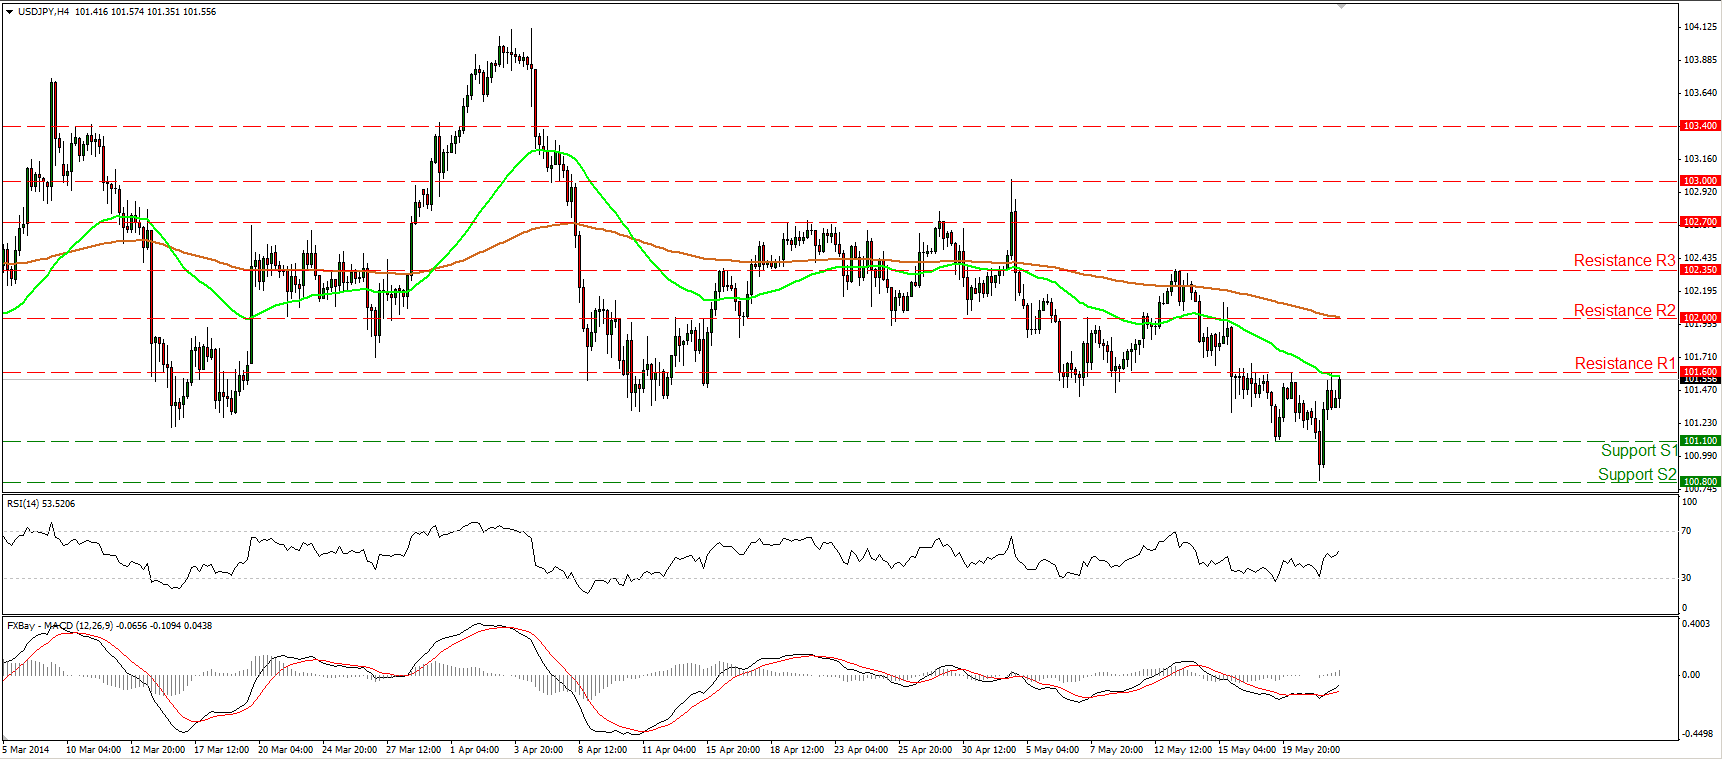
The USD/JPY fell sharply yesterday, but after finding support at the 100.80 (S2) zone, near the 200-day moving average, it rallied to trade slightly below 101.60 (R1). In early European trading the rate seems ready to challenge that barrier and an upside violation may see the next resistance obstacle at 102.00 (R2). Both our momentum studies are pointing up, while the MACD crossed above its signal line, favoring the continuation of the upside wave. Although I expect the forthcoming move to be bullish, in the bigger picture, the long-term path of USD/JPY remains to the sideways, since we cannot identify a clear trending structure.
• Support: 101.10 (S1), 100.80 (S2), 100.40 (S3).
• Resistance: 101.60 (R1), 102.00 (R2), 102.35 (R3).
EUR/GBP: Continues The Downtrend
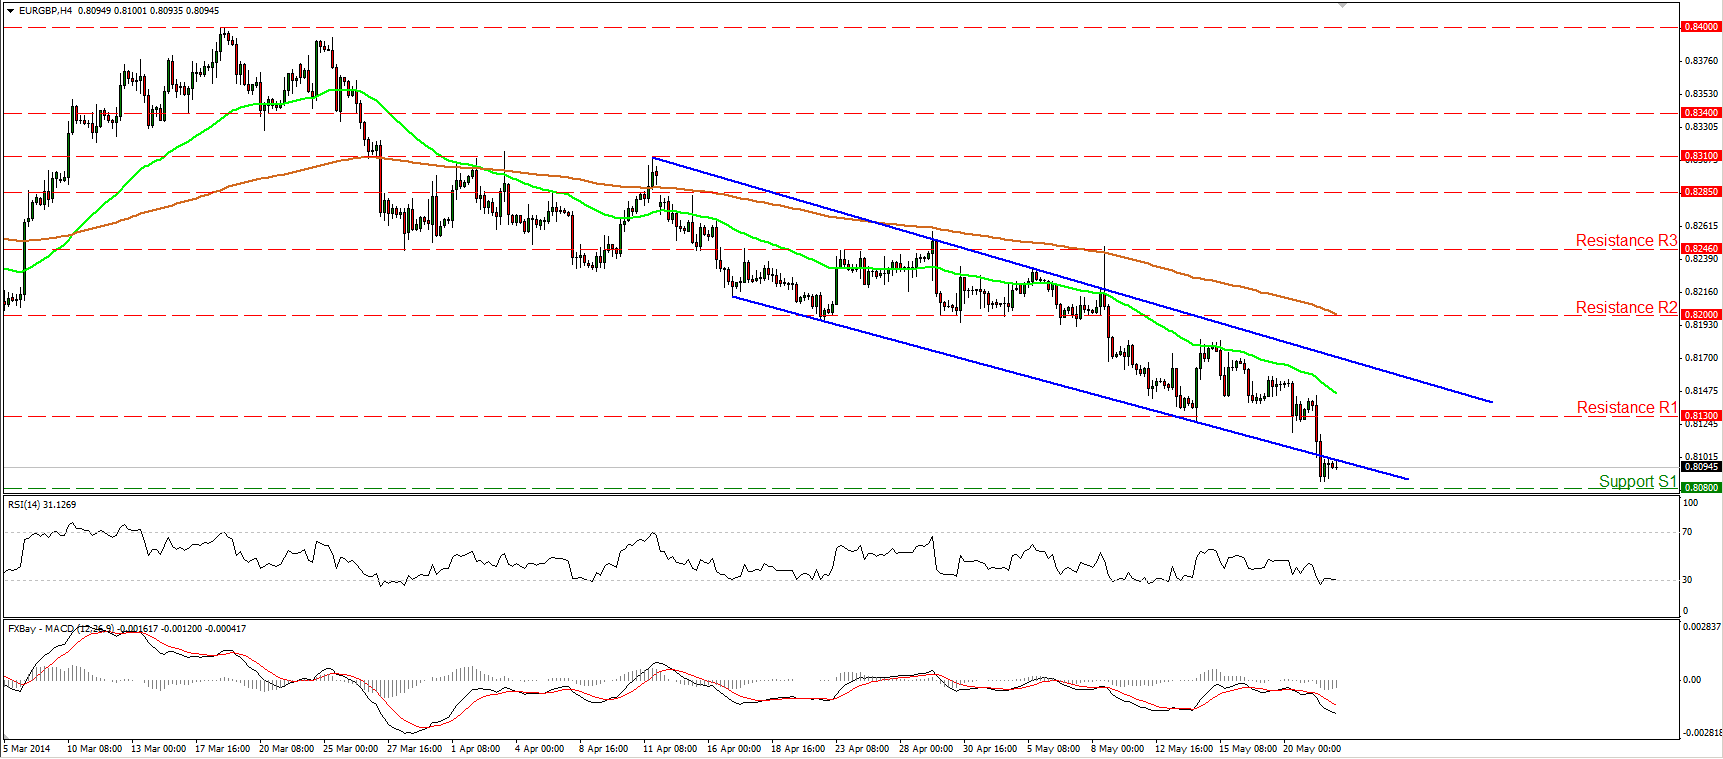
The EUR/GBP fell below the 0.8130 hurdle, confirming a lower low and signaling the continuation of the existing short-term downtrend. During the early European morning, the price lies slightly below the lower boundary of the blue downward sloping channel and slightly above our support barrier of 0.8080 (S1). Considering that the MACD remains below both its signal and zero lines, I would expect the bears to challenge that obstacle. A clear dip below it may target the next support at 0.8035 (S2).
• Support: 0.8080 (S1), 0.8035 (S2), 0.8000 (S3).
• Resistance: 0.8130 (R1),k 0.8200 (R2), 0.8246 (R3).
Gold: Remains Sideways
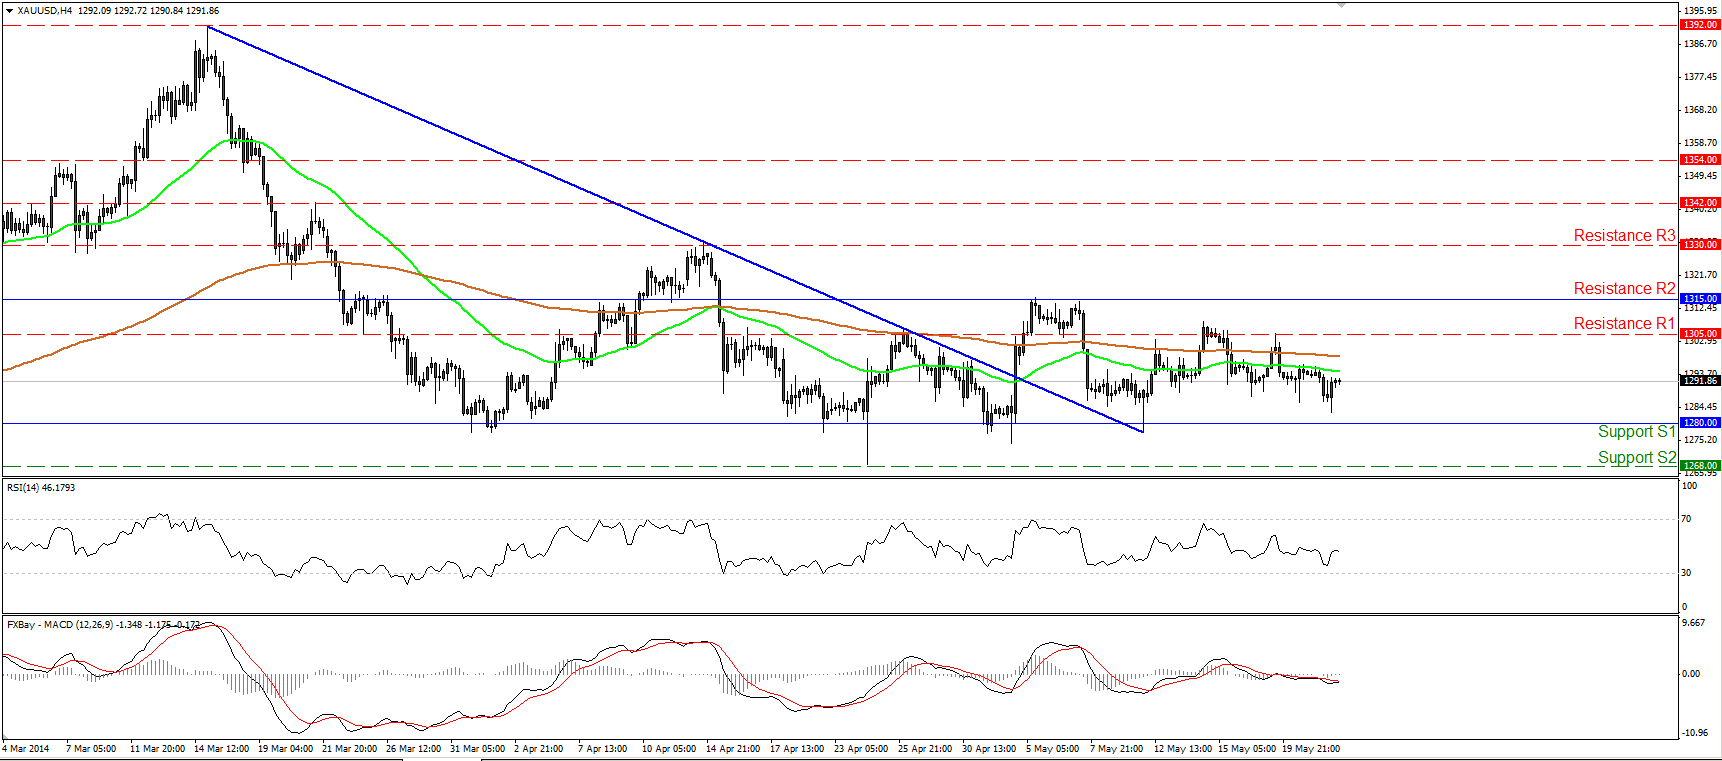
Gold continued consolidating on Wednesday, remaining near 1290. The precious metal seems to prefer a sideways path between the support of 1280 (S1) and the resistance of 1315 (R2). Both our moving averages continue to point sideways, while both the daily MACD and the daily RSI lie near their neutral levels, confirming the trendless picture of the yellow metal. A break above 1315 (R2) is needed to turn the picture positive and could target the resistance of 1330 (R3), while a dip below 1280 (S1) may see the support of 1268 (S2).
• Support: 1280 (S1), 1268 (S2), 1250 (S3).
• Resistance: 1305 (R1), 1315 (R2), 1330 (R3).
WTI: Reaches The Highs Of April
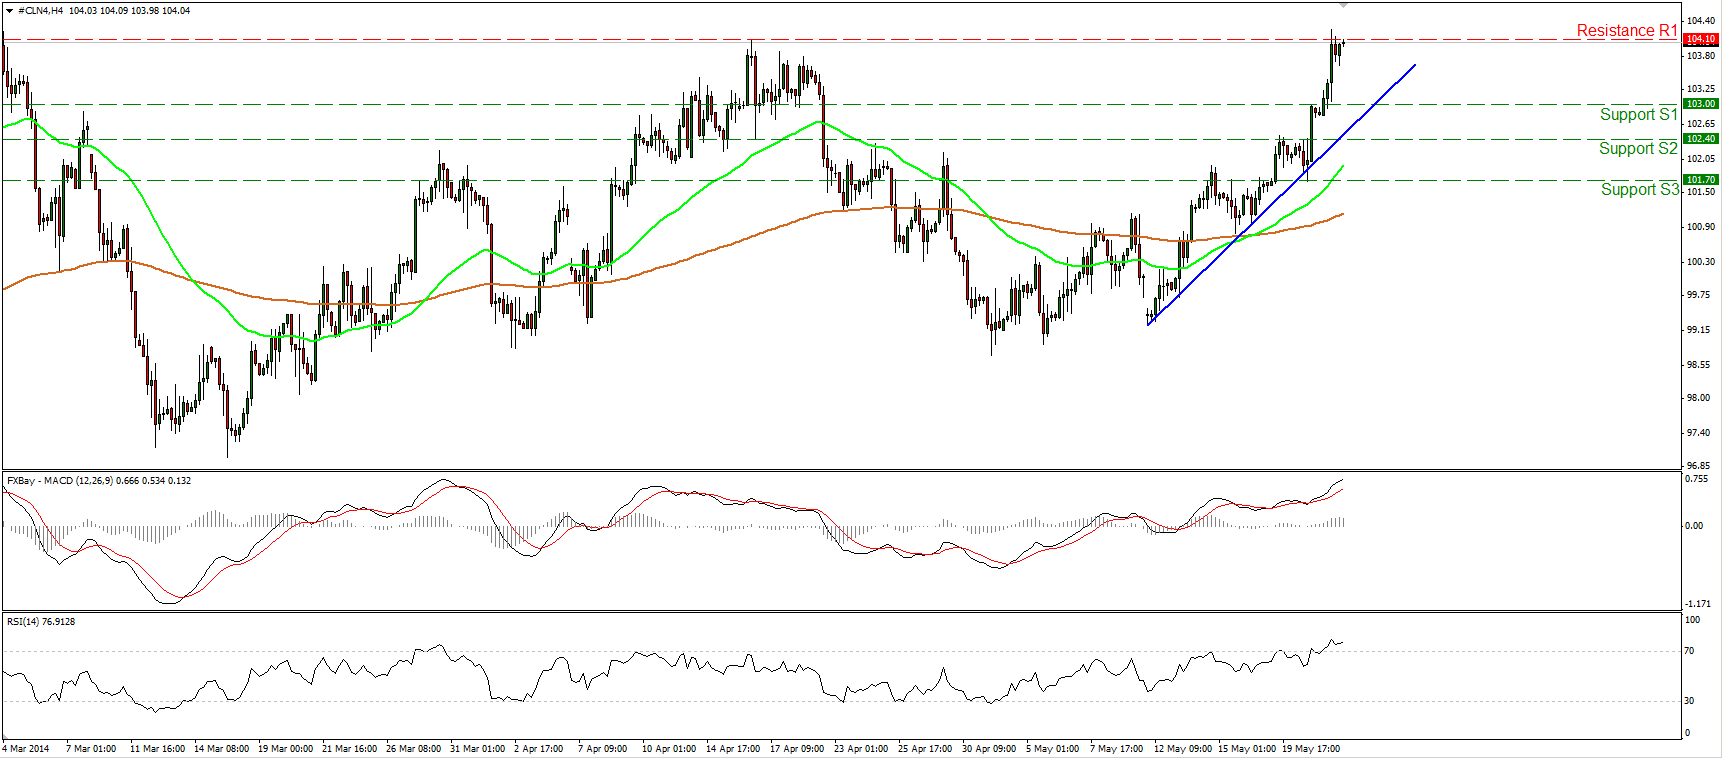
WTI moved higher and reached the highs of April at 104.10 (R1), as expected. If the longs are strong enough to overcome that barrier, I would expect them to overcome the aforementioned resistance and trigger extensions towards the critical barrier of 105.00 (R2). As long as WTI is printing higher highs and higher lows above both the moving averages, the uptrend remains in effect. However, I would expect some profit taking near the 104.10 (R1) bar, thus some consolidation or a pullback near the blue uptrend line cannot be ruled out.
• Support: 103.00 (S1), 102.40 (S2), 101.70 (S3).
• Resistance: 104.10 (R1), 105.00 (R2), 108.00 (R3).

