
The race to the bottom is on for the G3 with the JPY winning so far, though the Euro was also very weak today and the SEK was also very weak on the heels of the Riksbank meeting.
UK data sees further GBP short covering
The EURGBP rally over-reached itself lately it seems with our useful 20/20 hindsight as yesterday’s simply awful Euro Zone data contrasted sharply with a good Q3 GDP number out of the UK and an upbeat UK Index of services. The UK economy is hardly out of the woods, as the GBP rally may have been more about a positioning squeeze and even the disappointment over the upside down head and shoulders formation in EURGBP failing to bear fruit (as well as the general return of Euro pessimism, which by very definition is GBP-positive).
SEK
SEK fell to its lowest level versus the Euro after the very weak PPI number and after the Riksbank meeting, in which we saw sharp downward revisions for core inflation for 2013 and mention that the next rate move would be more likely down than up. Duh! Note that the 200-day moving average in EURSEK is just ahead at about 8.71, however.
US Data
The US data releases today were quite positive on the surface of things, with another weekly initial jobless claims print below 375k and a strong Durable Goods Orders number, although history shows that the latter is a volatile number and this is only the second month-on-month reading above 0% for all of 2012, meaning that the 3-month average year-on-year comparisons are still running at -2%. As for the hope that consumption is going to lift the US economy to the next level, let’s remember that the expiration of the payroll tax cut and some of the spending cuts from the fiscal cliff at minimum await on January 1.
Also, it was a bit disappointing that the core US Capital Goods orders number was flat on the month (despite a -0.9% downward revision of the previous month, too) and is likewise down about 2% on the 3M/YoY basis and down 6% on a 1M/YoY basis. The Citibank US data surprise index topped out around +50 recently on a weekly basis. While it has made a go twice in 2011 at +100, it has often topped out around this +50 level in years past, so be aware that the bar is rather high from here for further upside data surprises, particularly with poor results and outlooks rolling in from many US companies.
JPY weakness and interest rate moves
The JPY is weaker as one would expect with interest rates bumping up against important areas here. The US 5-year rate is poised right at the highest levels since April (albeit a mere 0.85%, but still…) and the 10-year is within a couple of bps of its highs over the same timeframe - and besides this recent bout of upside in yields, the benchmark has only closed a handful of weeks above its 40-week moving average since the spring of 2011. The JPY move will persist as long as these rate moves persist, but it’s a bit hard to see how rates will continue sharply higher beyond a certain point in the near term, at least in the US, with the prospect that the Fed will continue with operation twist until year end and now that it owns so much of the total issuance of these bonds. But stay tuned, as the JPY weakness has worked up considerable momentum.
Chart: NZDJPY
The RBNZ saw the short end of the kiwi rate curve perking up and taking notice as new RBNZ Governor Wheeler saw his first meeting at the bank’s helm. Meanwhile, the JPY crumbled broadly on the higher interest rates around the world. This has sent NZDJPY soaring, but mind the reversal potential if bond markets firm in the weeks ahead.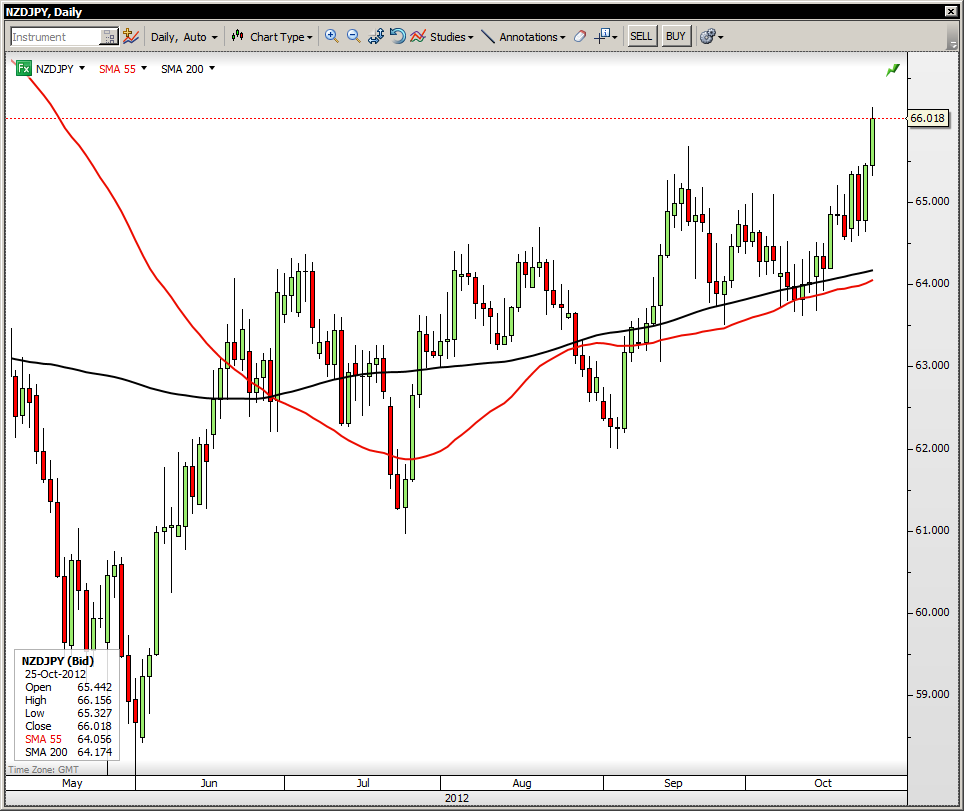 NZD/JPY" title="NZD/JPY" width="964" height="811">
Looking ahead
To close out the week, we have New Zealand’s trade data and business confidence survey and Japan’s inflation data out tonight, and US GDP and Michigan confidence data up tomorrow.
The USD picture is actually very mixed, as it’s really case of very strong Antipodeans and a sudden acceleration in GBP strength after its recent weakness, as well as the very weak Euro and even weaker JPY that are the driving themes of the moment, while the USD is a fairly passive observer. Perhaps the USD picture stays indeterminate until after the US election after all?
Economic Data Highlights
- Sweden Sep. PPI out at -0.7% MoM and -1.9% YoY vs. -1.9% YoY in Aug.
- Sweden Riksbank left rates unchanged as expected at 1.25%
- UK Q3 GDP first estimate out at +1.0% QoQ and 0.0% YoY vs. +0.6%/-0.5% expected, respectively and vs. -0.5% YoY in Q2
- UK Aug. Index of Services out at +1.0% MoM vs. +0.3% expected.
- US Sep. Chicago Fed National activity index out at 0.00 vs. -0.20 expected and -1.17 in Aug.
- US Sep. Durable Goods Orders out at +9.9% MoM and +2.0% ex Transportation vs. +7.5%/+2.0% expected, respectively
- US Sep. Capital Goods Orders, ex Defense and aircraft out at 0.0% MoM vs. +0.8% expected
- US Weekly Initial Jobless Claims out at 369k vs. 370k expected and 392k last week
- US Weekly Bloomberg Consumer Comfort Index out at -34.6 vs. -34.8 last week
- US Kansas City Fed Manufacturing Activity (1500)
- New Zealand Sep. Trade Balance (2145)
- Japan Sep. National CPI (2330)
- New Zealand Oct. NBNZ Business Confidence Survey (0000)