Businesses, consumers and the federal government have taken on enormous amounts of debt since the Great Recession. Optimists argue that total debt is irrelevant; that is, they believe the only thing that matters is the cost of servicing those debts. Fair enough. Then what happens when interest expense does rise? Assuming total debt remains the same, higher rates would increase the percentage of household income or the percentage of corporate/government revenue that must be allocated to debt servicing.
In earlier commentary, I provided data showing how the total debt of corporations has DOUBLED since 2007. Thanks to seven years of zero percent rate policy, alongside a number of iterations of quantitative easing (QE), the average rate on corporate debt is down from eight years ago. More critically, however, average interest expense has risen substantially. That’s right. Corporations need to assign more and more of their “gross” toward paying back the interest on their loans.
What about households? Well, we’re back to the 2007 record debt level of $14.1 trillion in mortgages, credit cards, auto loans, student loans and credit cards; the typical household has nearly $130,000 in total debt. The good news? Years of stimulative monetary policy has made it easier for households to service these debts.
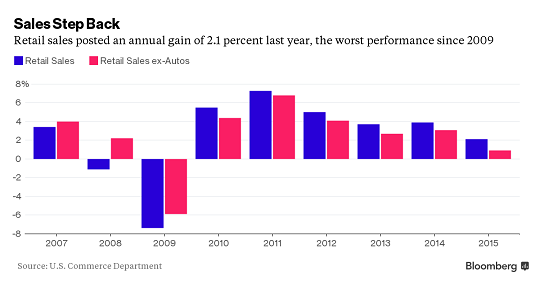
The bad news? Americans “re-leveraged” rather than “de-leveraged.” Any amount of rate hike activity would damage the ability of average Americans to borrow-n-spend. In fact, recent retail data demonstrate just how little Americans feel they have left over to spend, in spite of massive savings at the gas pump.
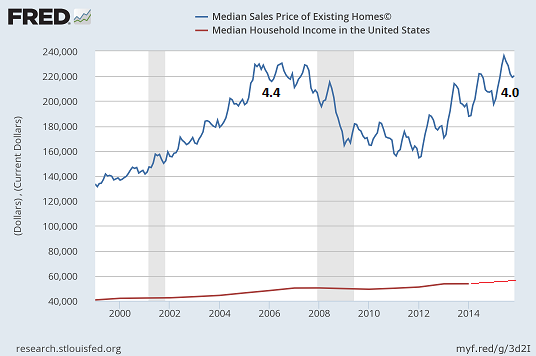
Traditional home affordability measures like median sales price-median income illustrate just how dependent we are on ultra-low interest rates. Specifically, the historical home price-to-household income ratio is 2.6. Where are we at today? Back near the housing bubble highs of 4.0.
It certainly does not get any better if one looks at U.S. government obligations. The national debt is roughly $19 trillion, excluding the country’s unfunded liabilities (e.g., Social Security, Medicare, Medicare prescription drug program, federal pensions, etc.). According to Dave Walker, the former head of the Government Accountability Office (GAO) under Presidents George W. Bush and Bill Clinton, the national debt is closer to $65 trillion, including unfunded liabilities.
Does anyone believe that those numbers are going to get smaller? Or even, heaven forbid, remain the same? In other words, rising interest expense or rising debt levels would make it even more difficult for the government to honor its obligations.
Is it any wonder, then, how schizophrenic riskier assets are? It is the direction of the Fed’s rate normalization path – no matter how gradual – that has nudged the bear out of hibernation. China? Its slowing economy adversely affects corporate profits, but it’s the Fed’s perceived reluctance to “save stocks” that has agitated market participants. Oil? Its rapid-fire descent highlights the possibility of a worldwide recession, though it is the Federal Reserve’s disinclination to “step in” that is rocking investor confidence.
Fortunately, there are a number of ETF relationships that can help a cash-heavy investor identify when things may be getting better. More precisely, when “risk-off” relationships abate, one may feel more upbeat about shifting from a mode of capital preservation to a mode of wealth accumulation.
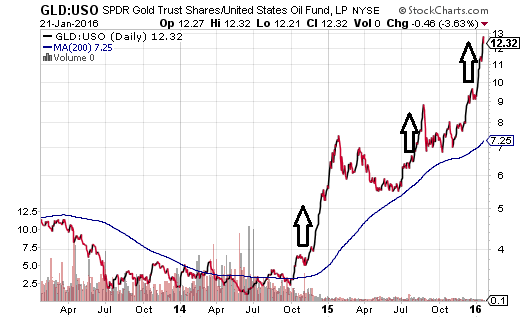
Consider the relationship between gold and oil. When people prefer the precious metal to the natural resource, they are expressing a preservation preference. And vice versa. When investors speculate that oil prices will rise, they are typically expressing confidence in the growth of the global economy. It follows that the SPDR Gold Trust (N:GLD):United States Oil Fund (N:USO) price ratio is likely to climb in troubling times; it is likely to spike in panicky stock sell-offs.
One might wish to see the slope of the GLD:USO 200-day moving average flatten out – and the GLD:USO price settle down a bit – prior to making huge commitments to riskier assets. Granted, the rapid depreciation of oil itself has had a fair amount to do with the general trend of GLD:USO. Nevertheless, all three of the most recent corrective phases in U.S. stocks – October of 2014, August-September of 2015, January of 2016 – dovetail perfectly with spikes in GLD:USO.
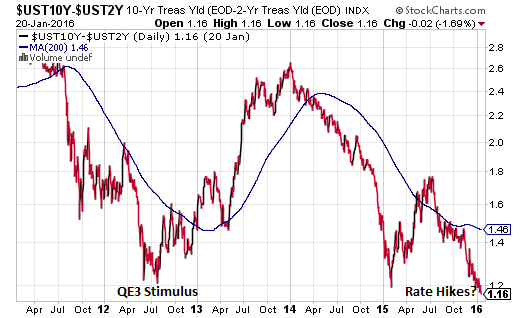
In the same vein, the flattening of the yield curve tells market watchers that participants are concerned about recession probabilities. The difference between the 10-Year Treasury bond yield and the 2-Year Treasury bond yield has fallen to lows that we haven’t seen since the Fed shocked-n-awed the world with its most powerful stimulus ever, QE3.
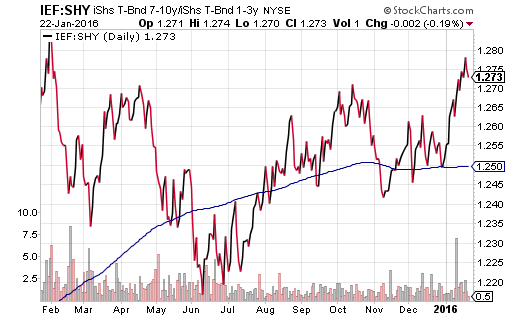
Of course, some folks prefer to remain in the world of specific ETF assets as well as rising/falling price ratio relationships. For those investors, I suggest that they track the iShares 7-10 Year Treasury Bond (N:IEF):iShares 1-3 Year Treasury Bond (N:SHY) price ratio. A rising price ratio implies that people are seeking safety in the middle of the yield curve, while others may be avoiding the short end of the yield curve due to Federal Reserve rate hike intentions. Thus, the yield curve is flattening when IEF:SHY is rising.
Since the stock market highs in July, IEF:SHY has, for the most part, been on a steady path higher. A sustained reversal in this trend would be an indication that investors are growing more comfortable with the health of the domestic economy.
Disclosure: Gary Gordon, MS, CFP is the president of Pacific Park Financial, Inc., a Registered Investment Adviser with the SEC. Gary Gordon, Pacific Park Financial, Inc, and/or its clients may hold positions in the ETFs, mutual funds, and/or any investment asset mentioned above. The commentary does not constitute individualized investment advice. The opinions offered herein are not personalized recommendations to buy, sell or hold securities. At times, issuers of exchange-traded products compensate Pacific Park Financial, Inc. or its subsidiaries for advertising at the ETF Expert web site. ETF Expert content is created independently of any advertising relationships.

