Risk aversion comes back via China News that the IMF was on its way to Ukraine with a USD 15bn rescue package calmed the markets during the European and US days yesterday and brought back some risk-seeking sentiment, aided by a better-than-expected US durable goods orders figure and soothing words from Fed Chair Janet Yellen. But overnight a record decline in the renminbi turned sentiment around again and risk aversion came back, causing a flight to safety into USD. Asian stocks were mixed, with China, Japan and Australia lower. The risk-sensitive currencies such as AUD, CAD and SEK lost vs USD while the safe-haven JPY gained, aided by an above-expectations rise in the national CPI for January that takes some pressure off the BoJ. The anomaly in this pattern was NZD, which gained after the ANZ business confidence survey rose to near a 20-year high.
The CNY declined 0.83% vs USD, the biggest intra-day drop in the seven years that the current trading system has been in place. The market believes that the Chinese authorities want to inject some two-way risk into CNY trading so as to discourage people from putting on carry trades in the currency. It’s also thought that the authorities are getting ready to double the trading band for the currency as part of their program to liberalize FX controls and increase the global use of the renminbi. A weakening of the currency has the potential to inflict serious financial damage to Chinese investors who have bought structured products linked to the FX rate however, so continued losses could cause the Chinese economy to slow.
During the European day, the main event will be Eurozone’s preliminary CPI for February, which is expected to have slowed to +0.7% yoy from +0.8% yoy in January. After the slowdown in Germany’s CPI on Thursday, the market will be waiting for these figures, since a negative surprise will put pressure to ECB to take action at next week’s meeting. Eurozone’s unemployment rate is expected to have remained at 12.0% in January.
In UK, the Nationwide house price index for February slowed to +0.6% mom from +0.7% mom in January, a bit better than expected (market forecast: +0.5%). This brought the yoy rate up to +9.4% from +8.8% and helped to boost the pound. At the same time, the German retail sales for January rose 2.5% mom, beating the 1.0% mom forecast and a solid turnaround from -1.7% mom in December. The news sent EUR/USD higher.
In the US, the second estimate of GDP for Q4 is expected to be revised down to+2.5% qoq on an annualized basis from the initial estimate of +3.2% qoq. Chicago purchasing managers’ index for February is forecast to have fallen to 56.4 from 59.6, and the University of Michigan final consumer sentiment for the same month to have seen no changes. These generally negative figures may depress USD. Pending home sales for January are estimated to have risen 1.8% mom, after a large fall of -8.7% mom the previous month.
Elsewhere, Canada’s GDP for December is expected to have declined 0.3% on a monthly basis, a turnaround from +0.2% mom in November. That could add to the recent pressure on CAD.
Eight speakers are on Friday’s agenda. Bank of England Governor Mark Carney and ECB's Board Member Sabine Lautenschlaeger speak on a panel at the Symposium on Financial Stability and the Role of Central Banks. Dallas Fed President Richard Fisher speaks on US monetary policy at the Swiss National Bank, while Federal Governor Jeremy Stein, Minneapolis Fed President Kocherlakota, Chicago Fed President Evans and Philadelphia Fed President Plosser will speak on a panel discussion. Bank of England Executive Director for Financial Stability Andrew Haldane will also speak.
The Market
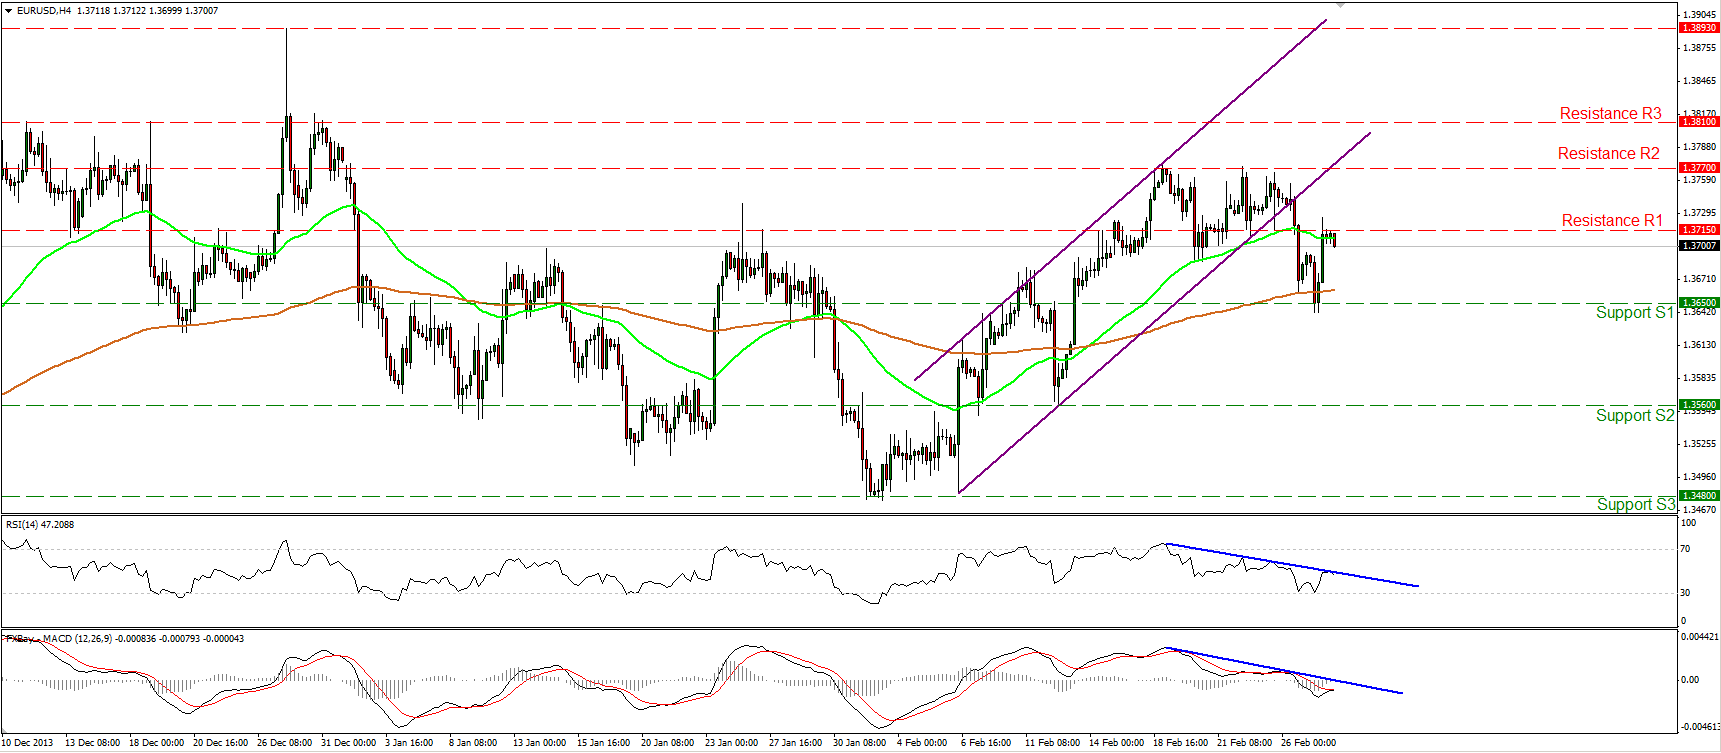
• EUR/USD moved higher after finding support at the 1.3650 (S1) barrier. Nonetheless, the rise was stopped at 1.3715 (R1). If the rate forms a lower high near that barrier, I would expect extensions back towards the 1.3650 (S1) support for another test. A clear break of that obstacle could trigger extensions towards the bar of 1.3560 (S2). The RSI is testing its blue resistance line, while the MACD, despite the price rally, holds its negative sign, indicating that the momentum remains bearish.
• Support: 1.3650 (S1), 1.3560 (S2), 1.3480 (S3).
• Resistance: 1.3715 (R1), 1.3770 (R2), 1.3810 (R3).
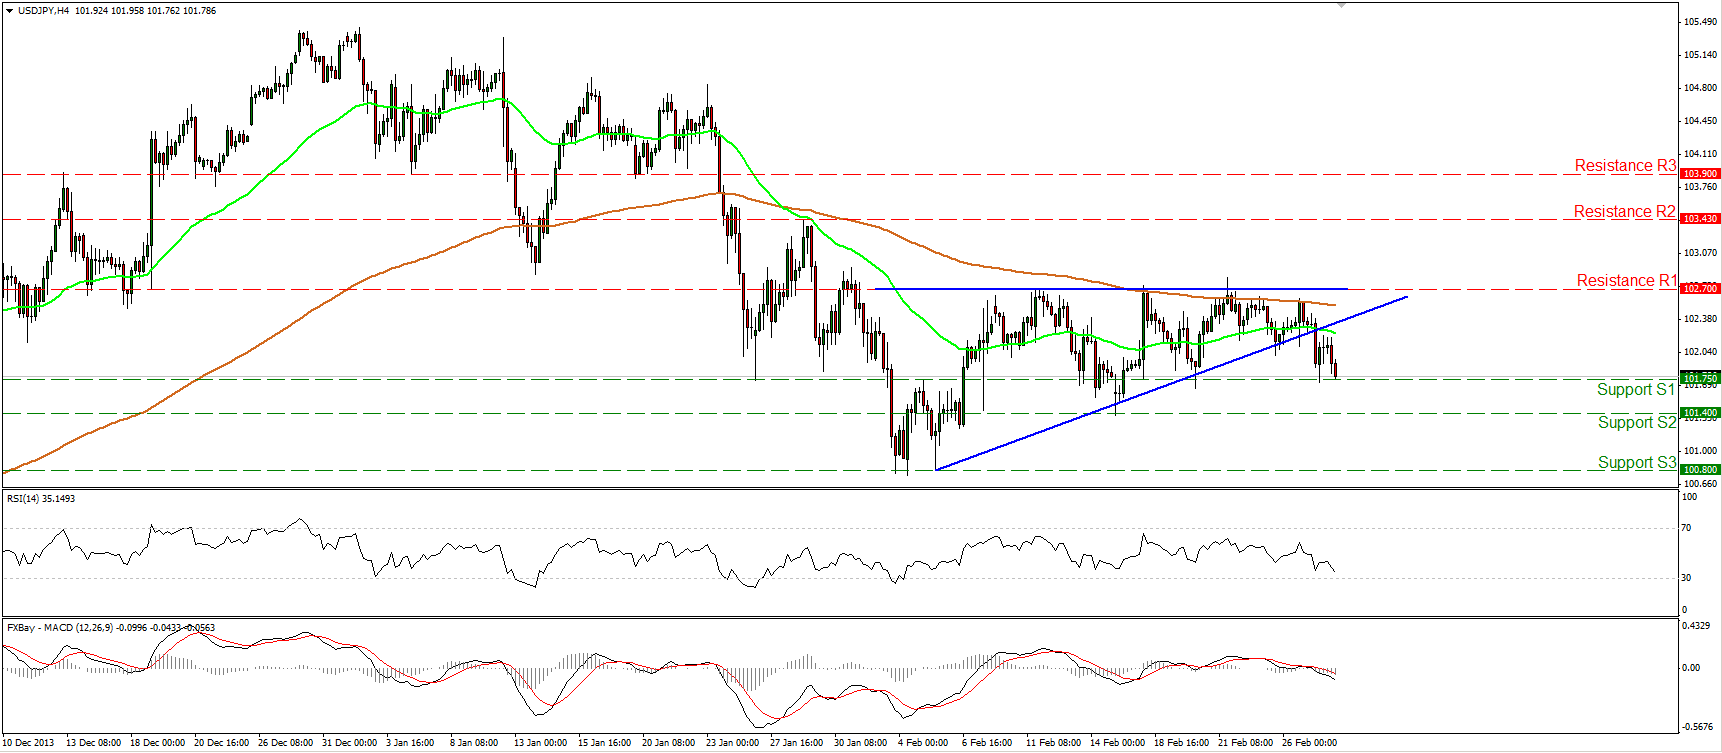
• USD/JPY fell below the lower boundary of the ascending triangle after meeting strong resistance at the 200-period moving average. The pair is now testing the support at 101.75 (S1). A clear break could open the way for the lows at 100.80 (S3). The MACD crossed below both its trigger and zero lines confirming the recent bearish momentum of the currency pair. As mentioned in previous comment, only a violation of the 102.70 resistance (R1) would turn the picture positive.
• Support: 101.75 (S1), 101.40 (S2), 100.80 (S3)
• Resistance: 102.70 (R1), 103.43 (R2), 103.90 (R3).
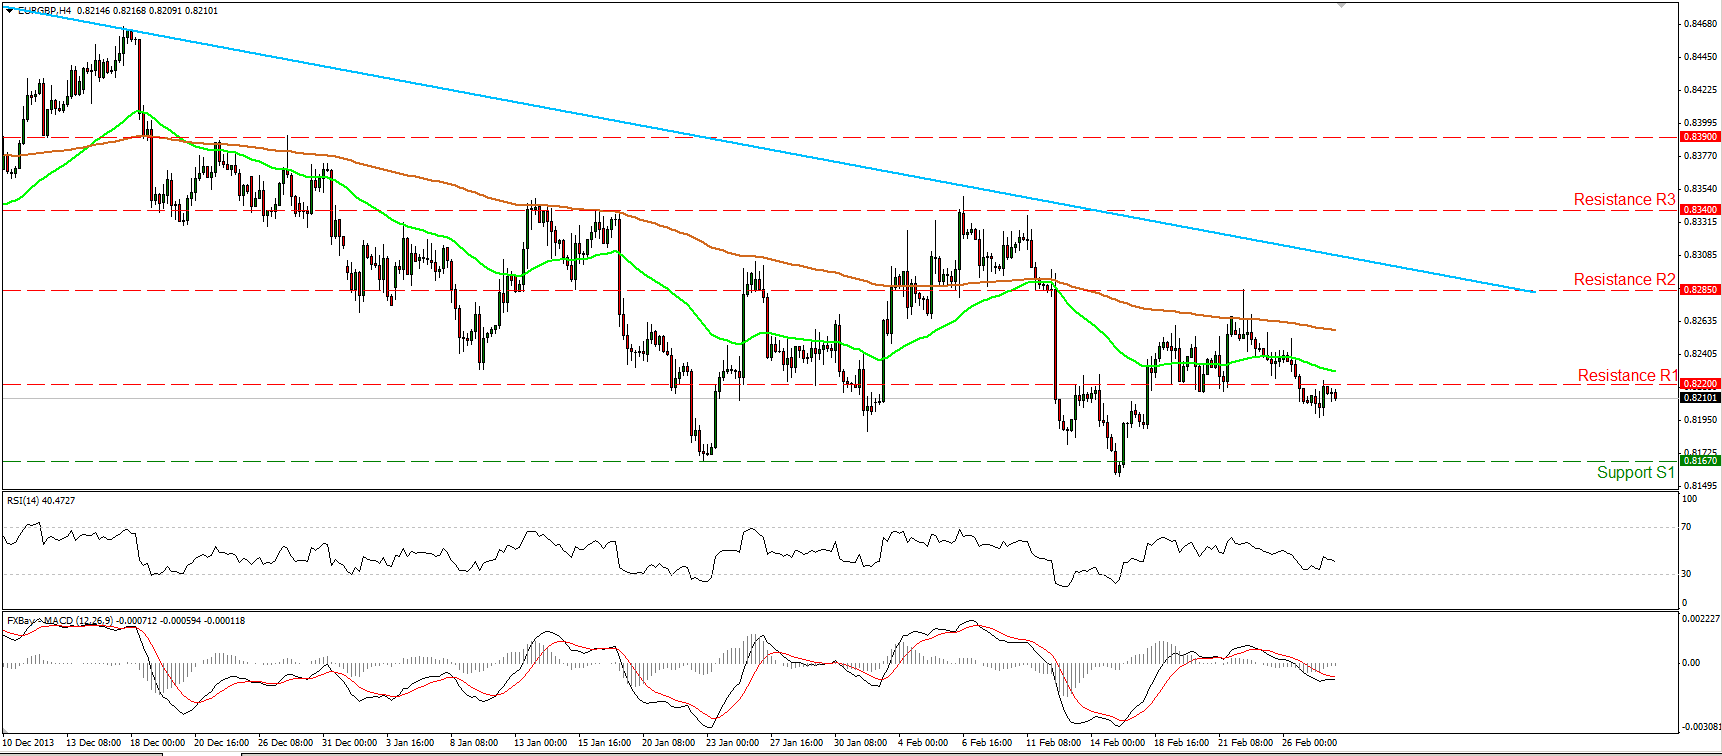
• EUR/GBP moved lower and is currently consolidating slightly below the resistance of 0.8220 (R1). In my view, the pair may continue moving lower and challenge the support of 0.8167 (S1) once again. Moreover, a dip below that bar would have larger bearish implications and may target the next obstacle at 0.8080 (S2). On the daily chart, the rate remains below both the moving averages and the longer term downtrend line, thus I consider the longer-term downward path to remain intact.
• Support: 0.8167 (S1), 0.8080 (S2), 0.8035 (S3).
• Resistance: 0.8220 (R1), 0.8285 (R2), 0.8340 (R3).
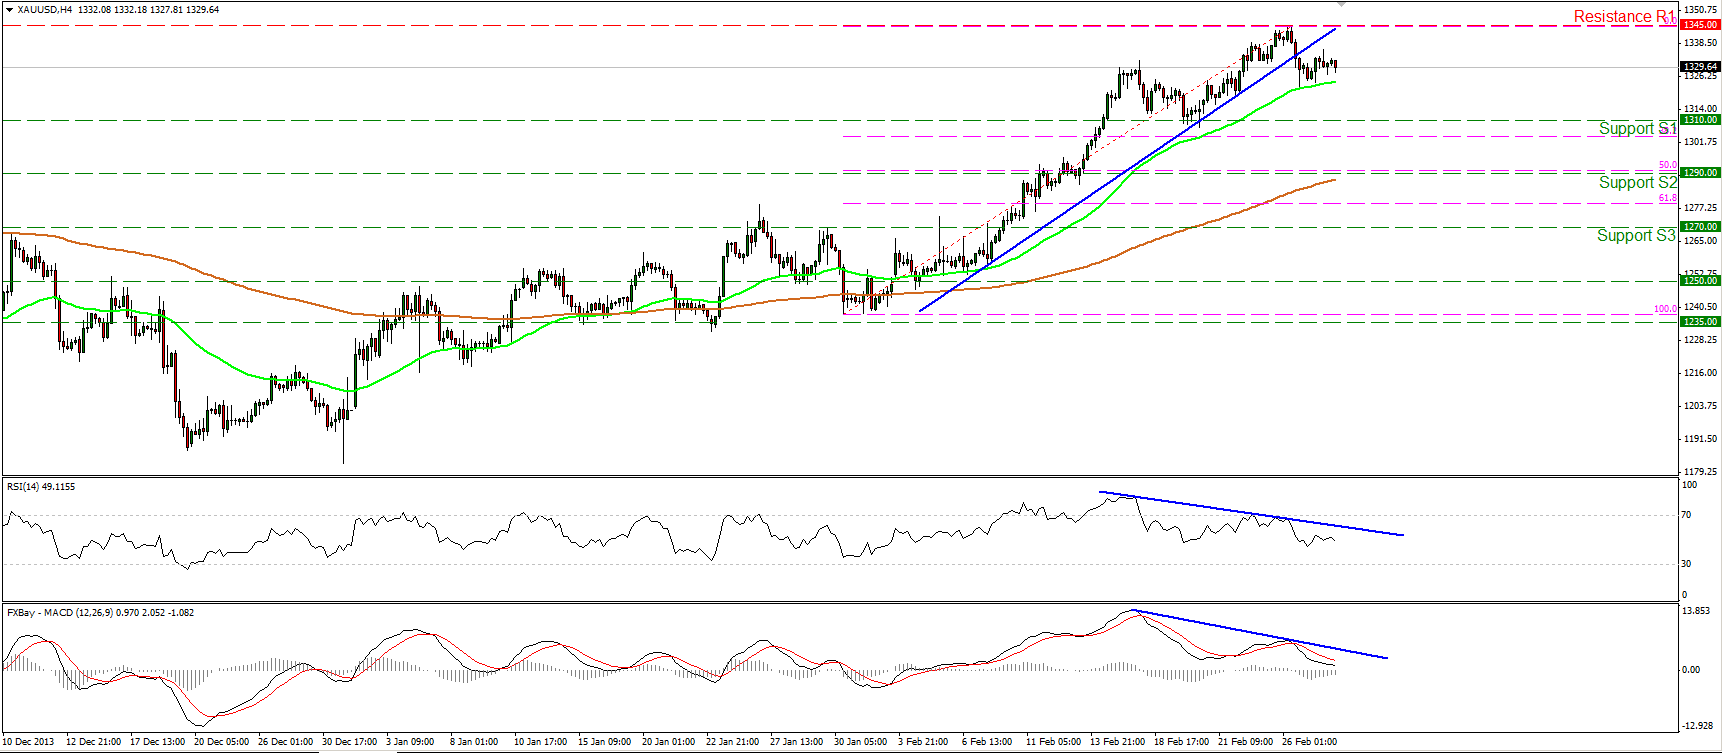
• Gold moved in a consolidative mode, remaining supported by the 50-period moving average. Considering the negative divergence between our momentum studies and the price action, I would expect the precious metal to retrace further. On the daily chart Tuesday’s and Wednesday’s candles formed a bearish engulfing pattern, enhancing the probabilities for further retracement.
• Support: 1310 (S1), 1290 (S2), 1270 (S3).
• Resistance: 1345 (R1), 1360 (R2), 1376 (R3)
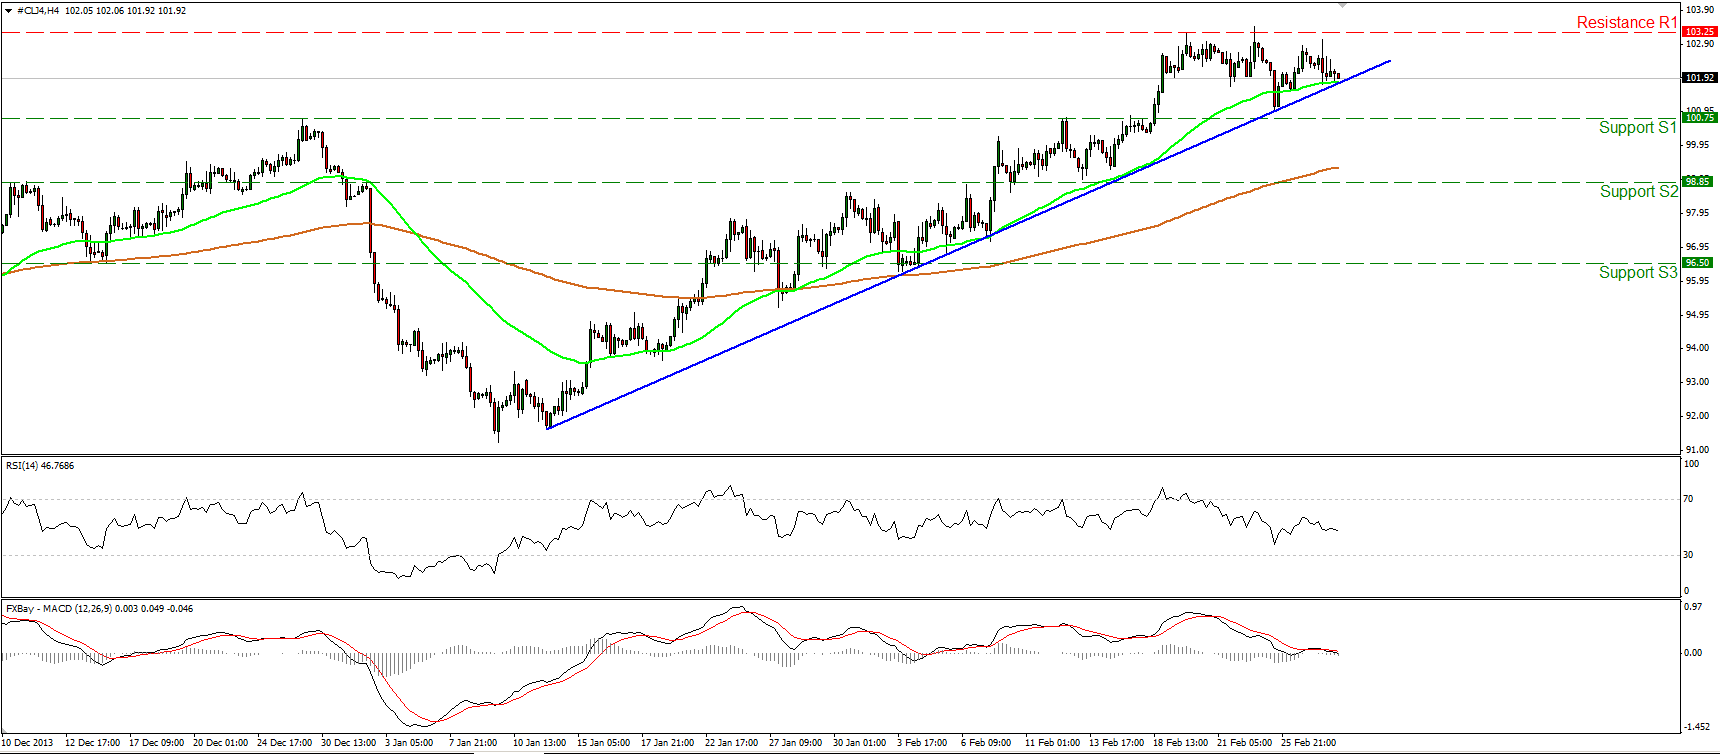
• WTI moved slightly lower and is now trading near the 50-period moving average and the blue short-term uptrend line. I change my view to neutral for now, since the price remained below the 103.25 (R1) for an extended period of time, while both momentum studies are moving lower with the MACD crossing below both its signal and zero lines. A clear close below 100.75 (S1) may flip to bias to the downside, while an upward violation of the 103.25 (R1) resistance is needed to signal the continuation of the uptrend.
• Support: 100.75 (S1), 98.85 (S2), 96.50 (S3).
• Resistance: 103.25 (R1), 104.35 (R2), 108.15 (R3).
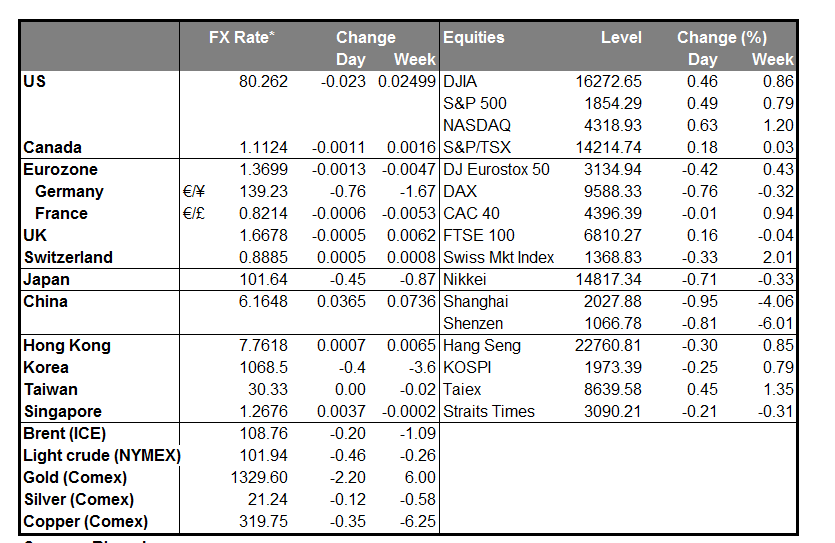
BENCHMARK CURRENCY RATES - DAILY GAINERS AND LOSERS
MARKETS SUMMARY

