
EOG Resources Inc. (NYSE:EOG) reported second-quarter 2016 adjusted loss of 38 cents per share, narrower than the Zacks Consensus Estimate of loss of 49 cents. However, the quarterly results reflect a massive deterioration from the year-ago quarter adjusted earnings of 28 cents amid weak commodity prices and lower production volumes.
Total revenue in the quarter plunged more than 28% year over year to $1,775.7 million. Nonetheless, the top line beat the Zacks Consensus Estimate of $1,600 million.
Operational Performance
During the quarter, EOG Resources’ total volume dipped 1.8% from the year-earlier level to 50.1 million barrels of oil equivalent (MMBoe) or 551.1 thousand barrels of oil equivalent per day (MBoe/d).
Crude oil and condensate production in the quarter totaled 267.7 thousand barrels per day (MBbl/d), down 3.5% from the prior-year level. Natural gas liquids (NGL) volumes increased 14.7% from the year-ago quarter level to 84.3 MBbl/d. On the other hand, natural gas volumes decreased to 1,194 million cubic feet per day (MMcf/d) from the year-earlier level of 1,257 MMcf/d.
Average price realization for crude oil and condensates was down more than 24% year over year to $43.65 per barrel. Quarterly NGL prices fell more than 6% to $14.56 per barrel from $15.54 a year ago. Natural gas was sold at $1.44 per thousand cubic feet (Mcf), down 40% year over year.
EOG RES INC Price, Consensus and EPS Surprise
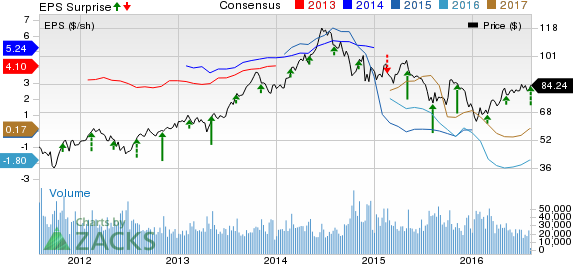
EOG RES INC Price, Consensus and EPS Surprise | EOG RES INC Quote
Liquidity Position
At the end of the second quarter, EOG Resources had cash and cash equivalents of $779.7 million and long-term debt of $6,979.3 million. This represents a debt-to-capitalization ratio of 36.7%.
During the quarter, the company generated approximately $580.7 million in discretionary cash flow compared with $1,237.9 million in the year-ago quarter.
Guidance
EOG Resources’ third-quarter total production is expected between 524.2 MBoe/d and 549.7 MBoe/d, which will include 75–79 MBbls/d of NGL and 1,085–1,139 MMcf/d of gas. For the full year, EOG Resources expects total volume between 533.5 MBoe/d and 551.5 MBoe/d, comprising NGL in the 76–80 MBbl/d range and natural gas in the 1,127–1,174 MMcf/d band.
For the third quarter as well as full year, the company expects crude oil and condensate volumes in the range of 268.4–280.8 MBbls/d and 269.6–275.8 MBbls/d, respectively.
The company maintained its total capital expenditure budget at $2.4 to $2.6 billion.
Zacks Rank
EOG Resources holds a Zacks Rank #3 (Hold). Some better-ranked players from the energy sector are Sasol Ltd. (NYSE:SSL) , Concho Reources, Inc. (NYSE:CXO) and Total SA (TO:TOT) . Each of these stocks sports a Zacks Rank #1 (Strong Buy).
TOTAL FINA SA (TOT): Free Stock Analysis Report
SASOL LTD -ADR (SSL): Free Stock Analysis Report
EOG RES INC (EOG): Free Stock Analysis Report
CONCHO RESOURCS (CXO): Free Stock Analysis Report
Original post
Zacks Investment Research