Pre-Open Market Analysis
The S&P 500 Futures continued its reversal up from Friday’s low. It should reach last Wednesday’s high within a week. Yesterday was strong enough so that last week’s low will probably lead to new high. It was a capitulation day. The bears gave up.
When they give up, there is usually at least one more leg up. This is because some are still short. They now know that the odds are that last week’s low will hold. These bears are hoping for any dip to allow them to exit with a smaller loss. In addition, the cautious bulls were waiting for evidence that the correction has ended. They got that yesterday. They therefore will be eager to buy a pullback. With both the bulls and bears hoping for a pullback, the odds are that any selloff will form a higher low.
The early February selloff was very strong. Therefore, the odds favor at least a small pullback from around 2725 – 2780. However, the bull trends on the weekly and monthly charts are still intact. Therefore, the bulls will buy any strong selloff. This means that the best the bears will probably get over the next month is a higher low.
Is the daily chart in a trading range, a bear trend, or a bull trend? Yes, yes, yes. However, the odds are that last week’s low will hold and that the Emini will be at a new all-time high within 3 months. It is in a bear trend because there is still a 20% chance of a 20% correction. If it comes, the bear trend will have started with the January high. If there is a higher low and then a new all-time high, traders will say that the bull trend resumed last week. Finally, until the Emini breaks strongly above the January high or below last week’s low, it is still in a trading range.
Since the monthly chart is in a strong bull trend, the odds are against much lower prices. Last week’s low will probably be the final low in the pullback from the all-time high.
Overnight Emini
The Emini is up 15 points in the Globex session. It will therefore probably gap above yesterday’s high and the 2700 Big Round Number. The bulls will probably buy any early selloff down to around that support.
The odds are that the rally will reach the February 7 lower high of 2726.25 within a few days. It might get there today. The bears hope the 5 day rally is just a buy vacuum test of that high. They want a double top bear flag on the daily chart and a resumption of the 2 week bear trend. The odds are that the rally will stall there for at least a couple of days. That is also around the 20 day EMA. This means that the Emini will probably begin to go sideways for 2 – 3 days starting today.
Since yesterday’s rally was climactic, there is a 50% chance of follow-through buying in the 1st 2 hours. There is only a 25% chance of a 2nd big bull trend day today. That would also be a strong break above the resistance of the February 7 lower high. In addition, there is a 75% chance of at least a 2 hour swing sideways to down that begins by the end of the 2nd hour.
Yesterday’s Setups
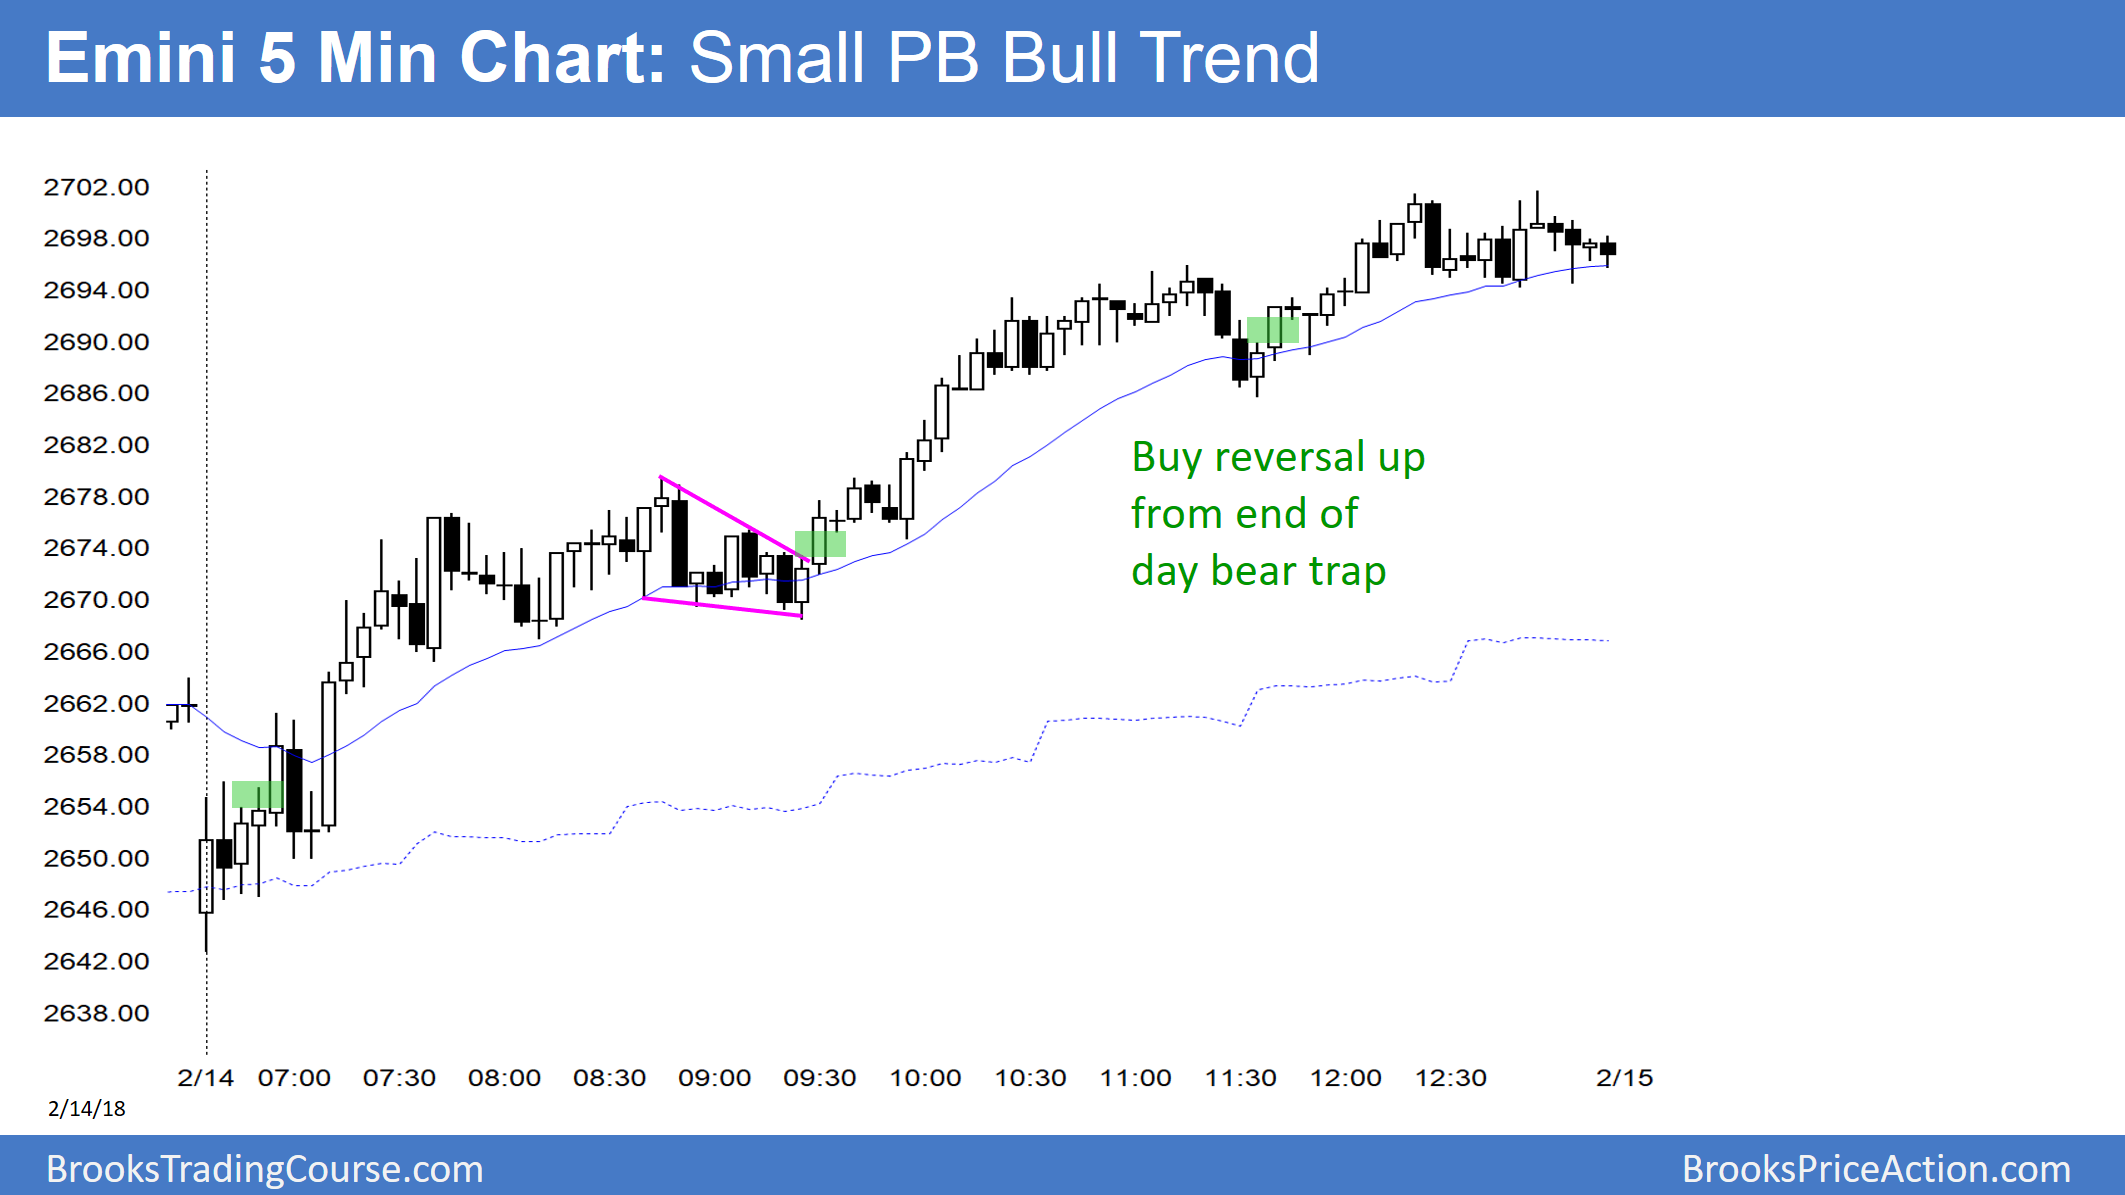
Here are several reasonable stop entry setups from yesterday. I sometimes also show limit order entries and entries on the close of bars.

