
Emini testing January high ahead of unemployment report
I will update again at the end of the day.
Pre-Open market analysis
The Emini S&P 500 sold off strongly yesterday, but reversed up from a dip below the January high. In fact, it rallied back above last week’s low. Therefore the bulls are hoping that this is just a test of major support.
However, the week is now an outside down week and the weekly chart is overbought. Yesterday might be a Give Up bar on the daily chart. If the bulls are giving up, the bears will probably get a couple legs down to around the 20 week EMA.
When there is a breakout, traders watch for follow-through. If today is a bull bar closing on its high, the bulls will expect the breakout to fail. They will then buy next week.
There is even a 30% chance that today will rally back above last week’s high. That would make the week outside up after being outside down. This would be a sign of strong bulls.
Since the weekly chart is overbought, the odds are that there will be lower prices over the next 2 weeks. Day traders will look to sell rallies to resistance, like the 60 minute EMA and last week’s low.
Because yesterday was a sell climax, there is a 75% chance that today will have at least a couple hours of sideways to up trading, beginning by the end of the 2nd hour.
Overnight Emini Globex trading
The Emini had a brief rally and then a brief reversal down on the unemployment report. As was likely after yesterday’s sell climax, it traded sideways overnight. It is currently down 6 points in the Globex session.
Yesterday’s late rally began at the January high and ended at last week’s low. These are important prices and the Emini might trade sideways within this range today.
Because today is Friday, there is an increased chance of a trend up or down in the final hour. Since last week was a sell signal bar on the weekly chart, the bears want today to close below last week’s low. Additionally, they would like the week to close below the September high. If they get either or both, it would increase the odds of lower prices over the next 2 weeks.
The bulls always want the opposite. But, to erase yesterday’s damage, they would need today to close back above last week’s high.
Yesterday’s big late reversal up created confusion. That usually results in at least a couple trading range days.
Yesterday’s setups
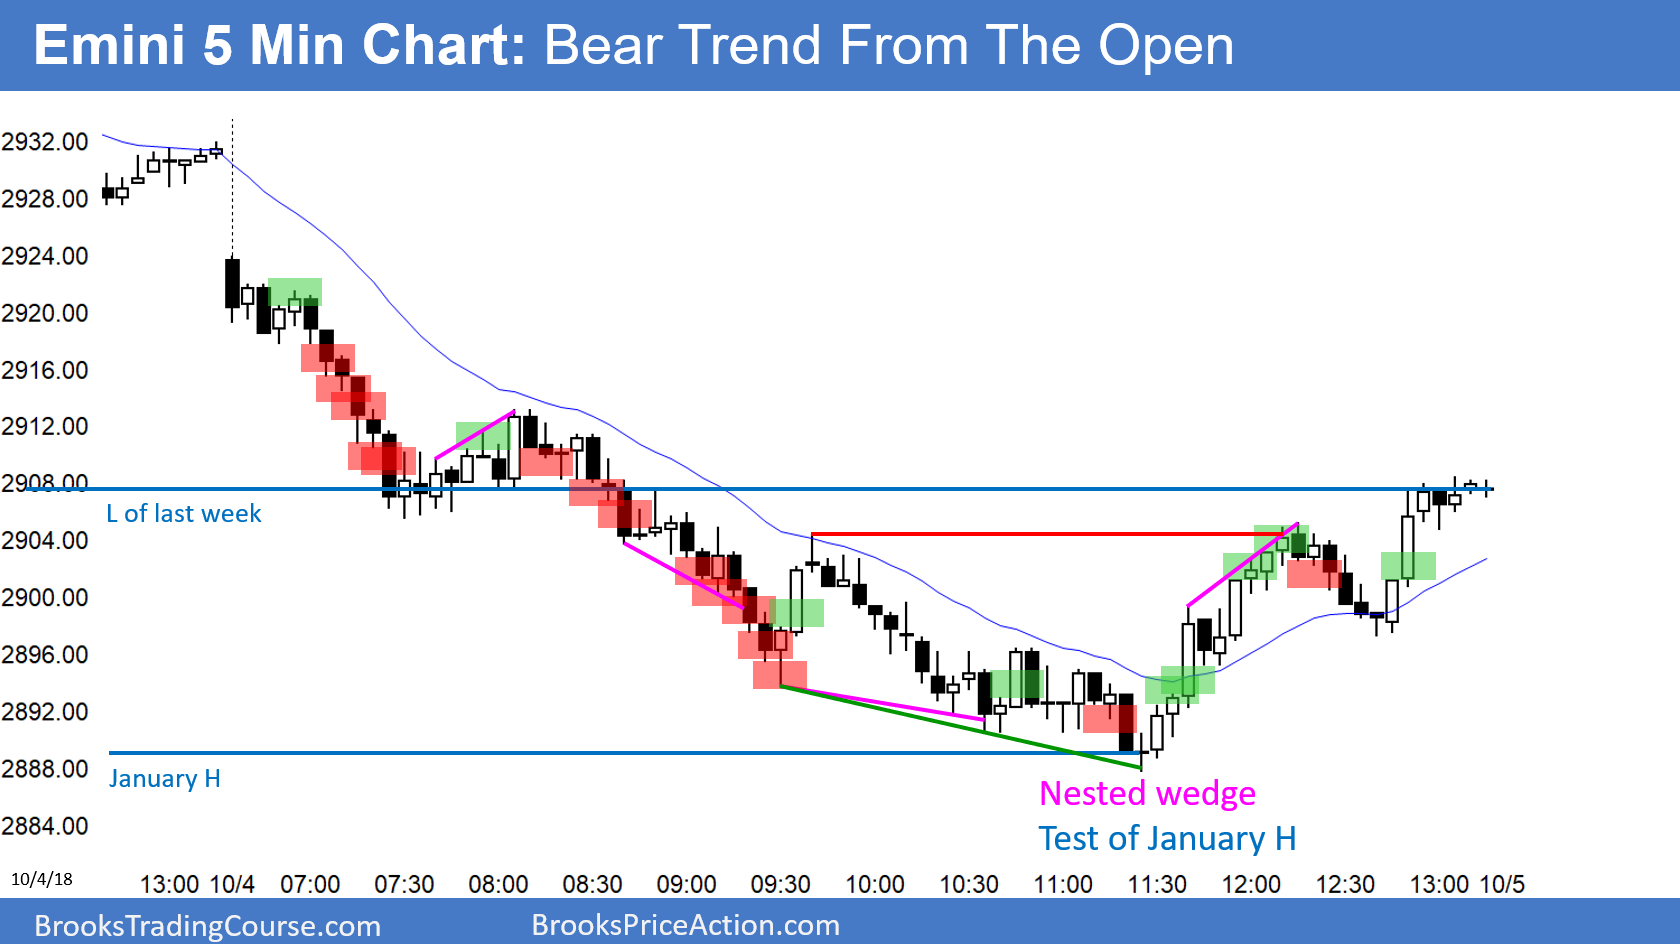
Here are several reasonable stop entry setups from yesterday. I show each buy entry with a green rectangle and each sell entry with a red rectangle. I rarely also show limit order entries and entries on the close of bars. My goal with these charts is to present an Always In perspective. If a trader was trying to be Always In or nearly Always In a position all day, and he was not currently in the market, these entries would be logical times for him to enter.