The euro will need to roll over for the ES to attract sellers.
The euro currency has been on an impressive run (much to our dismay) but few have acknowledged the impact the currency markets are having on stocks and commodities. In the last 180 trading sessions, the euro and the Emini S&P have settled in the same direction roughly 70% of the time. Thus, strength in the euro has helped hold the stock market afloat.
Similarly, commodities such as crude oil and copper have benefited from the change in currency valuation but might not fare so well if the euro finally succumbs to gravity. In short, if the dollar can find a way to reverse course (AKA the euro weaken) we should see bellwether commodities turn south and they could easily bring the S&P 500 with them. Keep an eye on the currency market, it could be ready to turn the corner!
Treasury Futures Markets
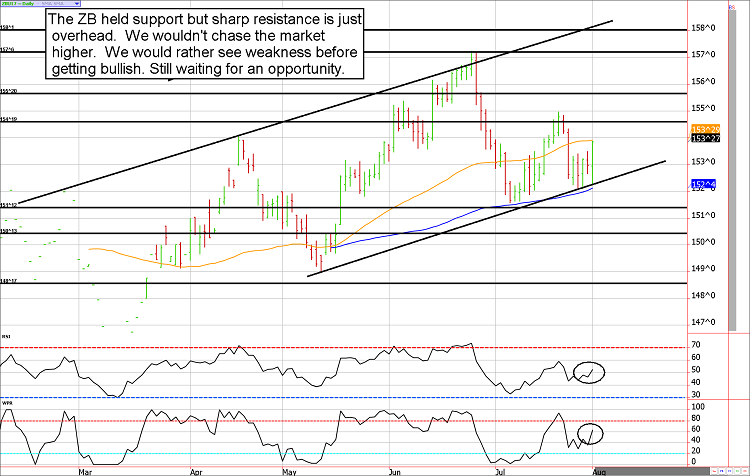
The Treasury chart is neutral in post-Fed trade. We don't see an edge either way.
Bonds and notes have been trading in a relatively tight range with little desire to make any sizable moves. There are obviously arguments for lower Treasuries and higher rates, but bond trades appear to be pricing in some risk premium that equity traders are ignoring. Further, the Fed has made it clear they are in no hurry to normalize rates; instead, they prefer to take things slow in light of emerging cracks (ok...more like hairline fissures) in the economy. In short, we don't see any reason to be overly bullish nor overly bearish from these prices.
That said, we acknowledge a seasonal buy in early August. In a perfect world, prices will soften considerably in the coming days to allow for comfortable entry of bullish speculations.
Treasury Futures Market Analysis
**Bond Futures Market Consensus:** We are in "wait and see" mode but would like to see a move to 150ish in the 30-year bond. We'd probably be comfortable bulls from that price.
**Technical Support:** ZB : 151'12, 150'10, and 148'17 ZN: 125'15, 124'24, 124'08, and 123'24
**Technical Resistance:** ZB: 154'19, 155'20, and 157'06 ZN: 126'15, 127'01, and 127'15
Stock Index Futures

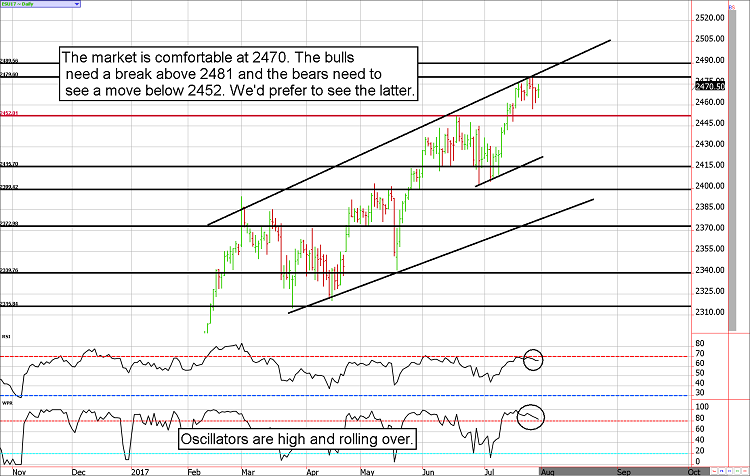
Light volume and zero conviction in the ES
The bears haven't been able to convert on an opportunity to turn the tides despite hefty trendline resistance. However, the bulls (although very comfortable and complacent) haven't had the conviction to forget a breakout.
We still believe the equity market is vulnerable to some profit taking but the reality is the closer we get to the jobs number the less likely that will happen until the news is out. In other words, the ES could drift higher, or sideways, into the news. It would take a considerably surprising headline to take the market down ahead of the payroll report. This is particularly true because payroll reports have been supportive to the equity market. That said, payroll reports tend to breed reversals. Aggressive bears might look to get "shorter" on a large Friday morning rally.
Stock Index Futures Market Ideas
**e-mini S&P Futures Market Consensus:**
The 2475ish area is trying to hold, but the bulls are relentless. Regardless of which side of the trade you are on, you should be hedging bets.
**Technical Support:** 2452, 2415, and 2399
**Technical Resistance:** 2479, 2489, and 2496
e-mini S&P Futures Day Trading Ideas
**These are counter-trend entry ideas, the more distant the level the more reliable but the less likely to get filled**
ES Day Trade Sell Levels: 2478 (minor), 2484, and 2496
ES Day Trade Buy Levels: 2465, 2487, and 2448
In other commodity futures and options markets....
May 5 - Buy August e-mini S&P 2000 puts for 5.75 ($287.50).
June 23 - Buy December corn near $3.80 and sell a $380 call option.
June 27 - Establish a covered call in October soymeal (purchase a futures contract near 298 and sell a 300 call.
June 29 - Sell September euro 118 call near 38 ticks.
July 7 - Exit covered call in soymeal to lock in a quick profit. Depending on fills it could have been anywhere from $800 to $980 before transaction costs.
July 19 - Sell the December e-mini S&P futures contract near 2462 and sell a 2460 put against it to provide a healthy upside hedge.
July 27 - Roll $1.18 September euro calls into lopsided strangles using 2 of the September $1.20 calls and 1 September $1.145 put.
July 27 - Exit December corn covered call to lock in a profit of $350 to $400 before transaction costs.
July 28 - Buy December Copper $2.50 puts for about $200.
August 1 - Buy back September Euro 114.5 put to lock in a small profit, then sell double the quantity of the 116 puts to give our short calls a better hedge.
(Our clients receive short option trading ideas in other markets such as gold, crude oil, corn, soybeans, Euro, Yen, and more. Email us for more information)
Carley Garner
DeCarley Trading (a division of Zaner)
Twitter:@carleygarner
info@decarleytrading.com
1-866-790-TRADE(8723)
www.DeCarleyTrading.com
www.HigherProbabilityCommodityTradingBook.com
**There is substantial risk of loss in trading futures and options.** These recommendations are a solicitation for entering into derivatives transactions. All known news and events have already been factored into the price of the underlying derivatives discussed. From time to time persons affiliated with Zaner, or its associated companies, may have positions in recommended and other derivatives. Past performance is not indicative of future results. The information and data in this report were obtained from sources considered reliable. Their accuracy or completeness is not guaranteed. Any decision to purchase or sell as a result of the opinions expressed in this report will be the full responsibility of the person authorizing such transaction. Seasonal tendencies are a composite of some of the more consistent commodity futures seasonals that have occurred over the past 15 or more years. There are usually underlying, fundamental circumstances that occur annually that tend to cause the futures markets to react in a similar directional manner during a certain calendar year. While seasonal trends may potentially impact supply and demand in certain commodities, seasonal aspects of supply and demand have been factored into futures & options market pricing. Even if a seasonal tendency occurs in the future, it may not result in a profitable transaction as fees and the timing of the entry and liquidation may impact on the results. No representation is being made that any account has in the past, or will in the future, achieve profits using these recommendations. No representation is being made that price patterns will recur in the future.
