Monthly S&P 500 Emini futures candlestick chart:
5th month in weak rally

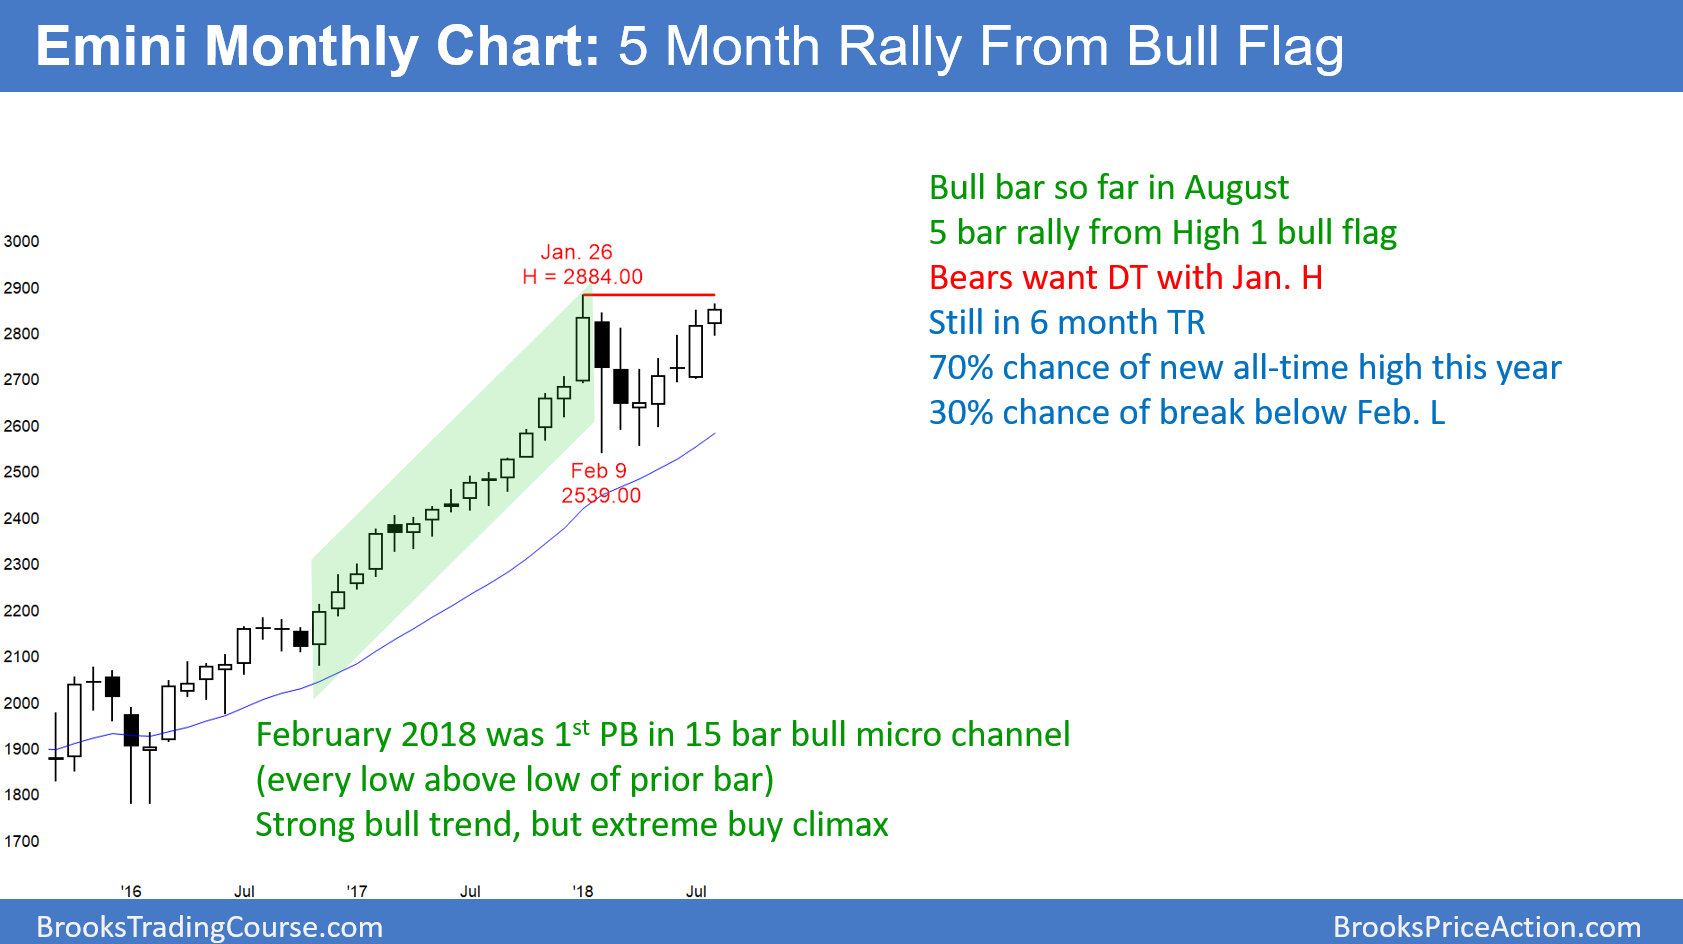
The monthly S&P 500 Emini futures candlestick chart has a small bar so far in August. The Emini is deciding between a double top and a breakout above the January high.
The monthly S&P 500 Emini futures candlestick chart has rallied 5 months after February’s strong selloff. The rally has lacked consecutive big bull trend bars. It therefore is unlikely to continue up for many more months. However, there are measured move targets on the weekly chart above 3,000. That is therefore a reasonable location for the start of a swing sideways to down.
The monthly chart is almost to the January high and the 5 month rally is not particularly strong. Therefore, there is a 50% chance of a reversal down to the middle of the 8 month trading range before a new high. Whether or not that happens, the odds still favor a new all-time high and a test to between 3,000 and 3,200 before there is a leg down on the monthly chart.
Weekly S&P 500 Emini futures candlestick chart:
Emini High 1 bull flag so imminent all time high

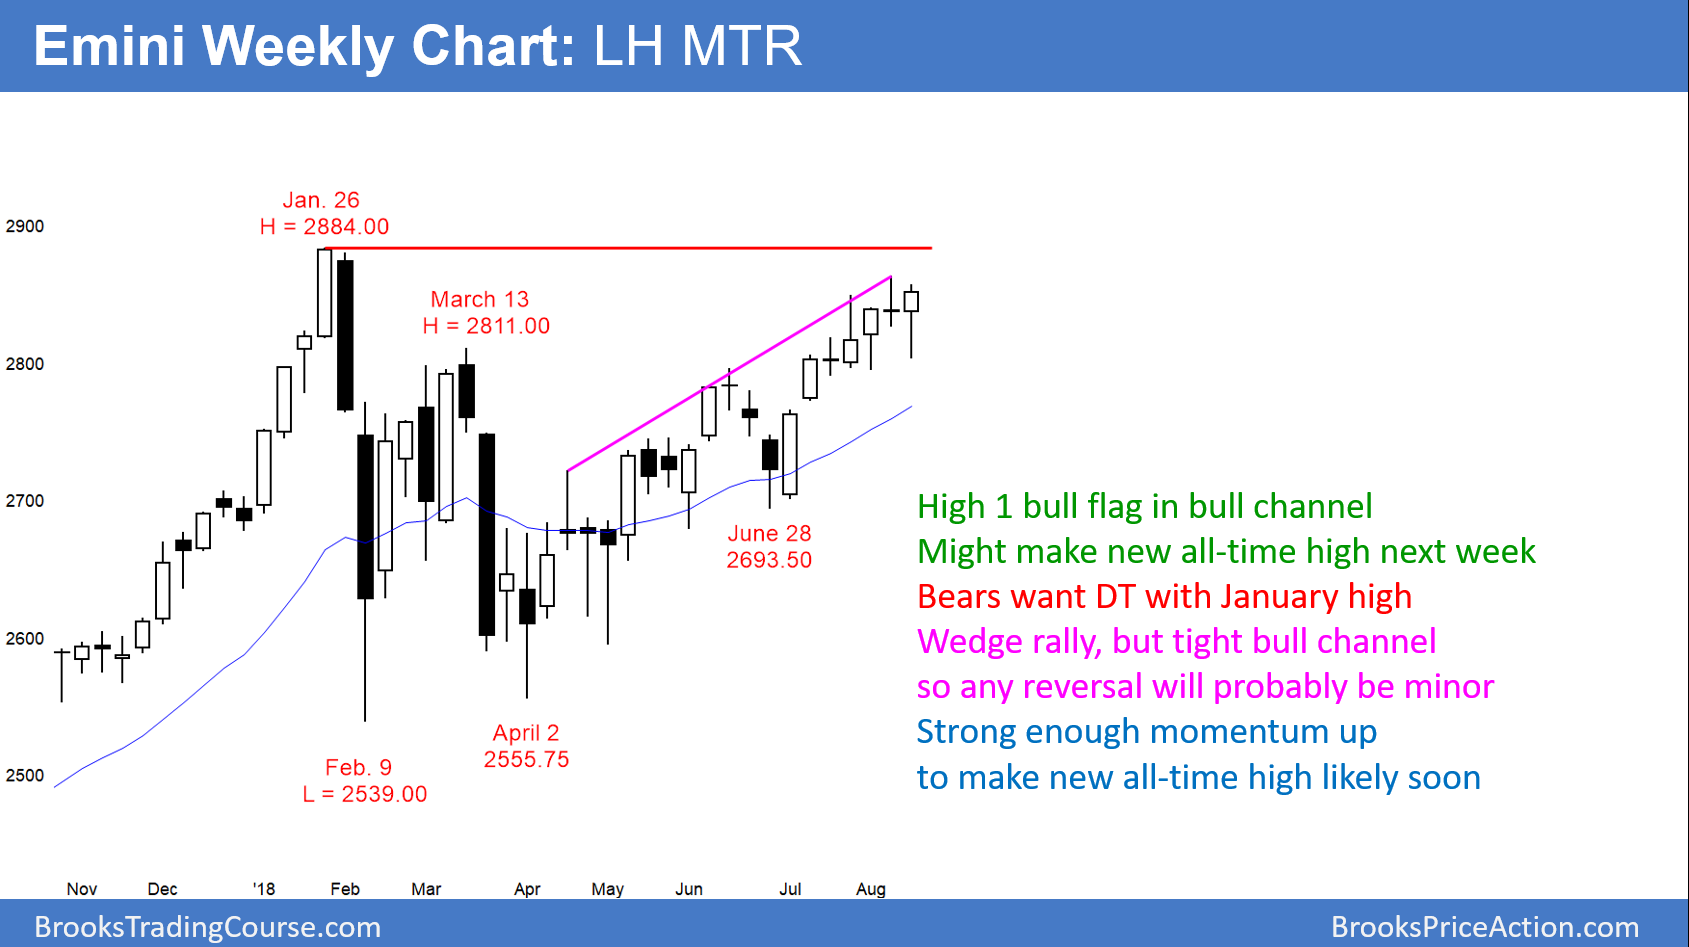
The weekly S&P 500 Emini futures candlestick chart has rallied strongly from the April low. It is now testing the January high. This week is a High 1 buy signal bar for next week. Less likely, the bears will get a double top with the January high and a reversal down
The weekly S&P 500 Emini futures candlestick chart is testing the January high. Last year’s rally was strong enough to be a Buy The Close (BTC) Bull Trend. Therefore, there are theoretically bulls who bought the January close. They were confident that either the rally would continue and they would make a profit, or the chart would enter a trading range and then rally back to their entry price.
These BTC bulls were disappointed by February. They therefore concluded that the weekly chart had evolved into a trading range. A bull trend usually does not become a bear trend without first transitioning into a trading range. These bulls therefore were confident that they could scale in lower and expect an eventual rally back up to the January close at the top of the range. That would allow them to exit with a profit on their lower buys and exit breakeven on their buy at the January close.
The current rally did not quite reach that January close. However, it is close enough so that it probably cannot escape the gravitational pull of that resistance. This makes it likely that the rally will continue up to a new high within a month or two. It could even come next week.
Daily S&P 500 Emini futures candlestick chart:
Possible bull breakout above bull channel

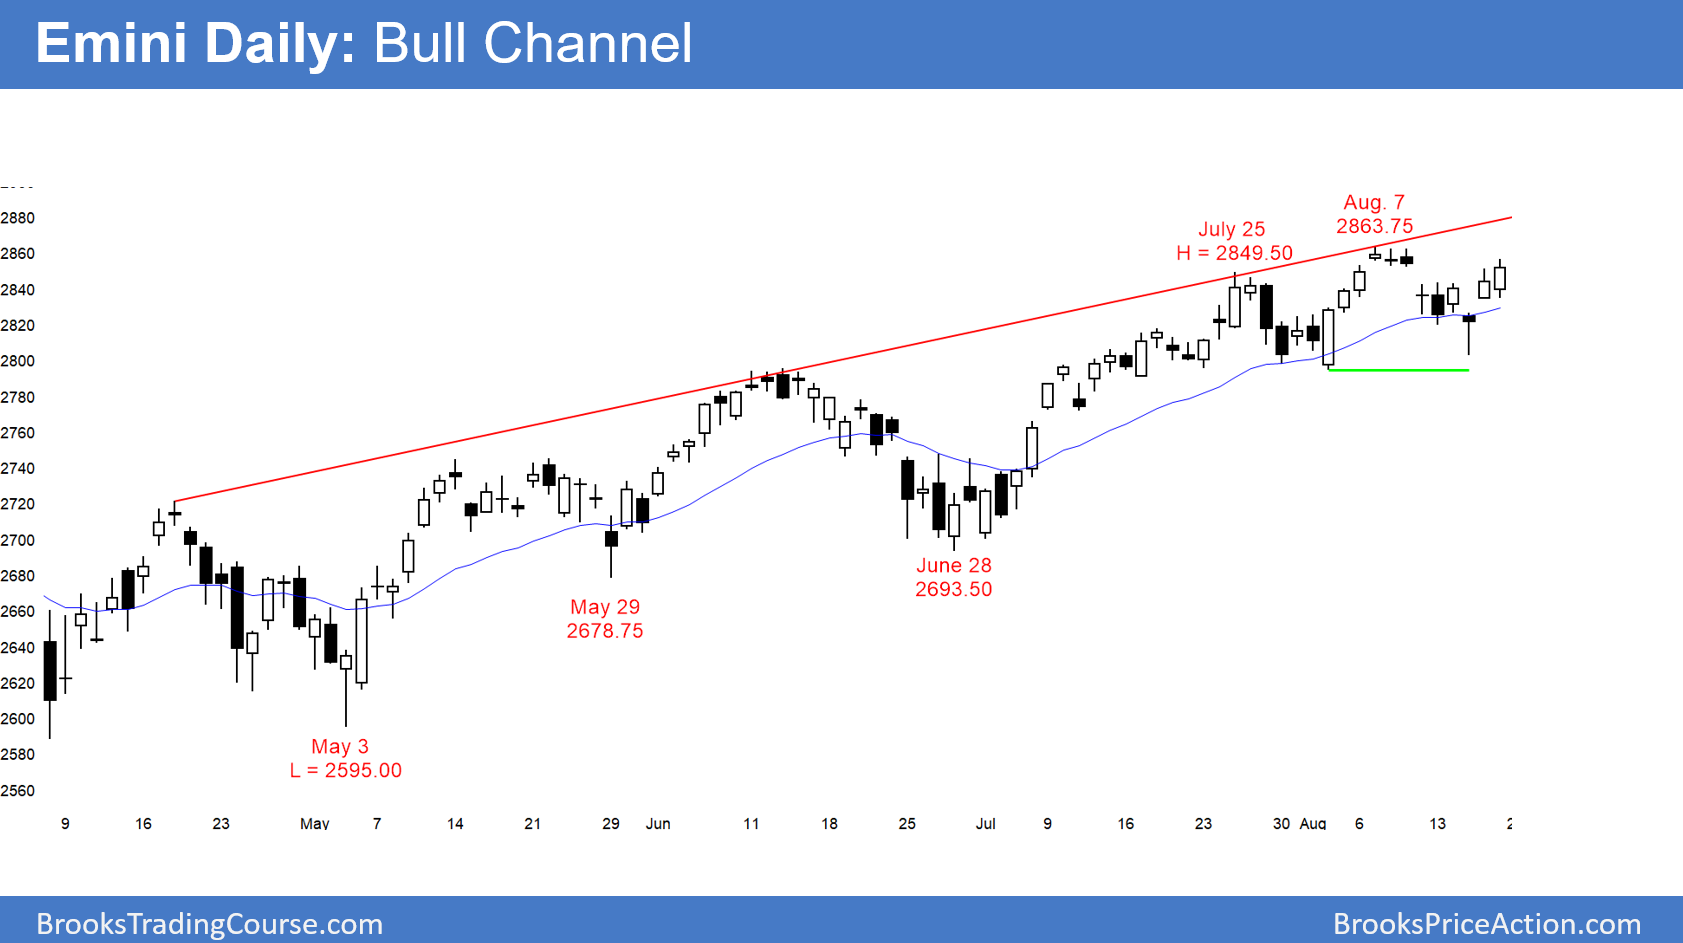
The daily S&P 500 Emini futures candlestick chart is rallying from a double bottom bull flag. The odds favor a new all-time high within 1 – 3 weeks. But, there is a 30% chance of a lower high major trend reversal over the next week. That would also be a head and shoulders top.
The daily S&P 500 Emini futures candlestick chart has been in a bull channel for 5 months. It reversed up this week from a higher low double bottom with the August 2 low. While the bears want a lower high and a head and shoulders top next week, the odds favor a new all time high within a few weeks. It might even come next week.
Traders will not believe that the bears have taken control until there is a series of big bear days and a break below the bull channel. Then, traders would need to see lower highs. This process would take weeks. Therefore, the downside risk over the next week is small.
Possible bull breakout above bull channel
It is important to note that a bull channel typically has a bear breakout and then the chart evolves into trading range. There is usually 1st a bull breakout above that fails within about 5 bars. That is then an exhaustive buy climax and the end of the bull trend.
However, 25% of the time, there is a successful bull breakout above the bull channel. When this happens, the market cycle starts over again. The breakout is a measuring gap instead of an exhaustive buy climax. As the breakout weakens, it evolves into a bull channel. That channel has a 75% chance of an eventual bear breakout, which then evolves into a trading range.
If the bulls get a strong breakout above this channel, it would also be a breakout above the 8 month trading range. A strong trading range breakout usually continues for a measured move up.
The bull channel from the April low is almost to the January high. The Emini could therefore simultaneously break above both the channel and the trading range. The result could be an explosive 300 point rally that races up to the measured move targets at 3,100 or 3,200.
An extreme example of a successful bull breakout above a bull channel happened in 1995 on the S&P cash index monthly chart. The S&P more than tripled its value over the next 5 years.
The Emini is not going to do that this time because the 2017 buy climax was so extreme. Furthermore, this is a much smaller pattern because it is on the daily chart. More likely, the rally will reach the 3,200 area and then pull back into this year’s trading range. That range will probably be the Final Bull Flag. Then, the Emini will probably enter a trading range for at least a year.
