
By going above Monday’s high yesterday, the Emini triggered a buy signal on the daily chart. I have been saying since Friday that the Emini would probably rally this week. Yesterday was a strong bull trend day. It briefly traded above the 3100.00 Big Round Number at the end of the day and pulled back sharply.
Yesterday had a dramatic rally and selloff into the close of the month and of the 2nd quarter. Because the buying was so climactic, there is a 75% chance of at least a couple hours of sideways to down trading today that starts by the end of the 2nd hour. The late reversal down might be the start. The uncertainty regarding tomorrow’s unemployment report is another factor that increases the chance of trading range trading today.
Monthly chart had bull doji in June
On the monthly chart, June had a small bull body with big tails above and below. It was basically a doji bar, and it was at the top of a 2 1/2 year trading range. That does not give traders much information regarding what to expect in July.
Because the Emini is near the top of the range, the upside in July is not great. However, after 3 bull bars on the monthly chart, the bears do not expect a bear trend. Therefore, traders expect the trading range to continue in July. The bulls have a 50% chance of a new high this summer.
Also, if the Emini trades below the June low, traders expect the selloff to end after a month or two, near the middle of the trading range.
Overnight Emini Globex trading
The Emini is down 12 points in the Globex session. Today and tomorrow are important days. If the bulls get one or two more bull trend days, the odds of a new all-time high will be more than 50%. If there is a big reversal down, traders will expect a correction down to the middle of the 2 1/2 year trading range.
Because yesterday had a huge climactic reversal, the 5 minute chart has a Big Up, Bid Down pattern. That creates Big Confusion. Since confusion is a hallmark of a trading range, traders expect at least a couple hours of trading range trading. It might begin on the open.
Huge moves like the 2 big bars at yesterday’s close often lead to a measured move. It can be up or down. If it is down, the Emini would test yesterday’s higher low.
If the move is going to be up, the Emini will probably 1st have to go sideways for a couple of hours before the exhausted bulls will buy aggressively again.
Yesterday’s setups
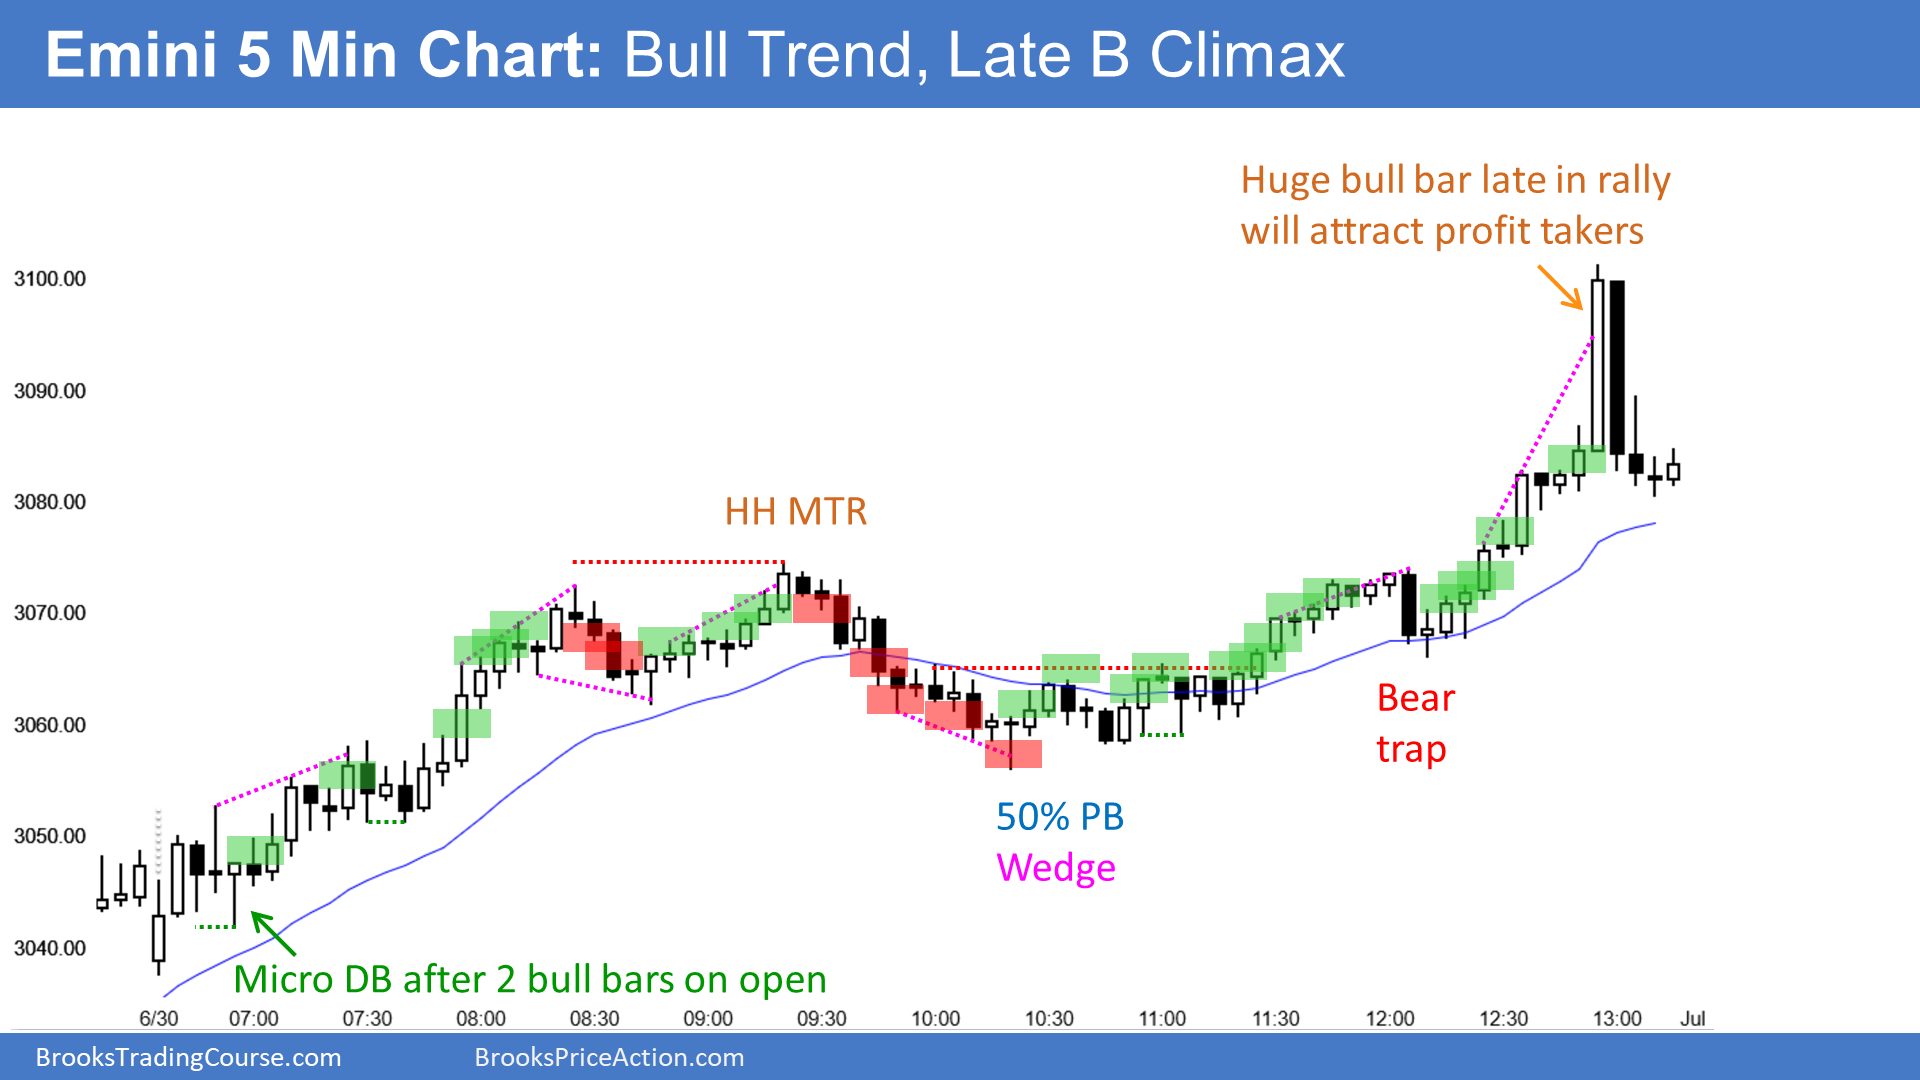
Here are several reasonable stop entry setups from yesterday. I show each buy entry with a green rectangle and each sell entry with a red rectangle. I rarely also show limit order entries and entries on the close of bars. I do not want the lines to be distracting. If they are longer, I make them dotted. But, they have to be visible, so I make the shorter ones solid. Buyers of the Brooks Trading Course and Encyclopedia of Chart Patterns have access to a much more detailed explanation of the swing trades for each day (see Online Course/BTC Daily Setups).
My goal with these charts is to present an Always In perspective. If a trader was trying to be Always In or nearly Always In a position all day, and he was not currently in the market, these entries would be logical times for him to enter.
If the risk is too big for your account, you should wait for trades with less risk or trade an alternative market like the Micro Emini.