Pre-Open market analysis
The Emini pulled back from a new high on Thursday. The rally to the new high was strong enough to make one more leg up likely.
The bulls might want a test down to the January 29 breakout point before buying again. That high is 3292.75. If there is a test there and a reversal up, the rally would be a 3rd leg up. That could lead to a wedge top and another test of the January 31 low.
The Emini has had trading range price action since late December. While it made a new high last week, the 2 week rally is probably a bull leg in what will be in hindsight a trading range. That means that traders should expect a bear leg in the trading range to begin within a couple weeks.
The daily chart is still in a bull trend. But because it is now also likely in a trading range, the odds favor a 2 – 3 week pullback to begin by the end of next week. The Emini still might get a 5 – 10% pullback before going much higher.
Overnight Emini Globex trading
The Emini is down 10 points in the Globex session. It might have to drift down to below the January 29 high of 3292.75 before there is another leg up. There can be swings up and down as the Emini works lower, but a strong move up or down is not likely today.
Friday was a small bear day. Its bear body makes Friday a weak High 1 bull flag buy signal bar for today. Consequently, there might be more sellers than buyers above its high. This reduces the chance of a rally today to above Friday’s high.
Thursday was not a strong sell signal bar. Friday was a small bear day will a prominent tail below. Traders see it as a weak entry bar for the bears.
With the past 2 days not being particularly good for the bulls or the bears, traders are expecting trading range price action today. This means that they expect that any trend lasting a few hours will evolve into a trading range or reverse into an opposite trend for a few hours. It reduces the chance of a big trend up or down today.
Friday’s setups

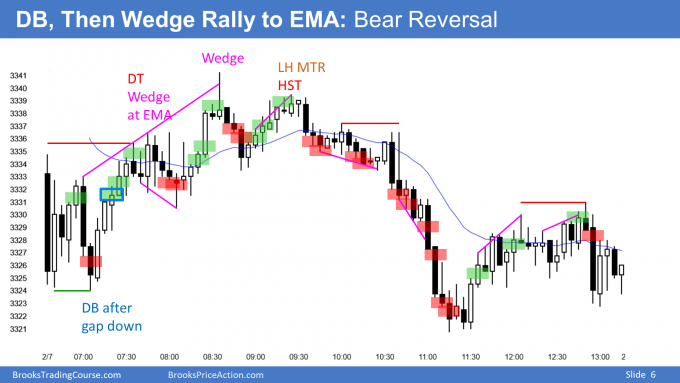
Here are several reasonable stop entry setups from Friday. I show each buy entry with a green rectangle and each sell entry with a red rectangle. I rarely also show limit order entries and entries on the close of bars. Buyers of the Brooks Trading Course and Encyclopedia of Chart Patterns have access to a much more detailed explanation of the swing trades for each day.
My goal with these charts is to present an Always In perspective. If a trader was trying to be Always In or nearly Always In a position all day, and he was not currently in the market, these entries would be logical times for him to enter.
