Get 40% Off
🚨 Volatile Markets? Find Hidden Gems for Serious Outperformance
Find Stocks Now

Emerging Vs. Domestic Markets

Published 06/20/2014, 10:19 AM

The ratio between the iShares MSCI Emerging Markets (ARCA:EEM) and the SPDR S&P 500 (ARCA:SPY) has produced some interesting setups this year. While EEM hasn’t been the strongest performer YTD, by applying some methods of technical analysis we are able to get an idea of where strength may or may not show up.

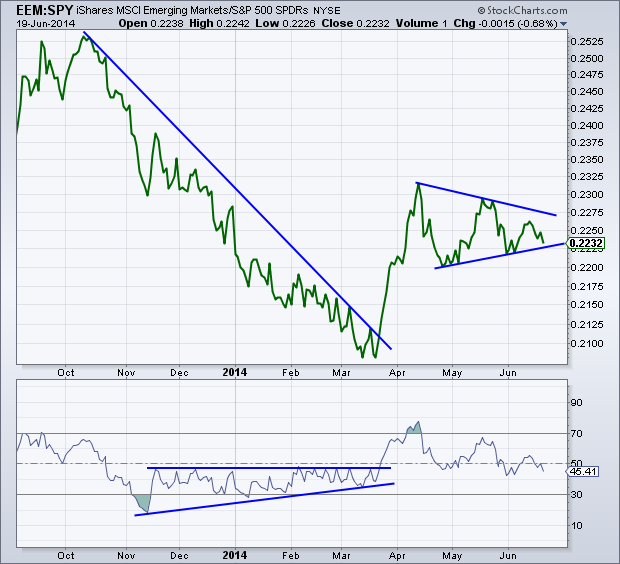
From the peak in relative performance against SPY last October, Emerging Markets underperformed for the next five and half months. During that time we saw the Relative Strength Index stuck in a bearish range, which supported the down trend in the ratio between EEM and SPY. While a positive divergence in RSI began to develop in January, the momentum indicator was unable to break above overhead resistance until late March. The break in momentum resistance also coincided with the break in trend line resistance for the price ratio. EEM was able to then outpace the S&P 500 for the following month.

Starting in April we can see in the chart below that the ratio between emerging and domestic markets began making lower highs and higher lows. This creates a symmetrical triangle pattern. Oftentimes we see the resolution of this type of pattern to favor the previous trend. But what’s interesting about this particular triangle pattern is that it was formed after a ‘trend’ (if you want to call it that) that lasted just one month. is that really enough time to obtain the overall bias?

I’ll be watching to see which direction this period of consolidation breaks and whether Emerging Markets or Domestic markets are able to win out in the end.

3rd party Ad. Not an offer or recommendation by Investing.com. See disclosure here or remove ads .

The Emerging Markets Vs. S&P 500

Latest comments

Risk Disclosure: Trading in financial instruments and/or cryptocurrencies involves high risks including the risk of losing some, or all, of your investment amount, and may not be suitable for all investors. Prices of cryptocurrencies are extremely volatile and may be affected by external factors such as financial, regulatory or political events. Trading on margin increases the financial risks.
Before deciding to trade in financial instrument or cryptocurrencies you should be fully informed of the risks and costs associated with trading the financial markets, carefully consider your investment objectives, level of experience, and risk appetite, and seek professional advice where needed.
Fusion Media would like to remind you that the data contained in this website is not necessarily real-time nor accurate. The data and prices on the website are not necessarily provided by any market or exchange, but may be provided by market makers, and so prices may not be accurate and may differ from the actual price at any given market, meaning prices are indicative and not appropriate for trading purposes. Fusion Media and any provider of the data contained in this website will not accept liability for any loss or damage as a result of your trading, or your reliance on the information contained within this website.
It is prohibited to use, store, reproduce, display, modify, transmit or distribute the data contained in this website without the explicit prior written permission of Fusion Media and/or the data provider. All intellectual property rights are reserved by the providers and/or the exchange providing the data contained in this website.
Fusion Media may be compensated by the advertisers that appear on the website, based on your interaction with the advertisements or advertisers.
© 2007-2024 - Fusion Media Limited. All Rights Reserved.