It is now clear that the Federal Reserve will be increasing interest rates this year. Therefore, it seems appropriate to look at the yield curve, specifically the 10-year and 3-month spread, to determine the Fed's impact on the curve.
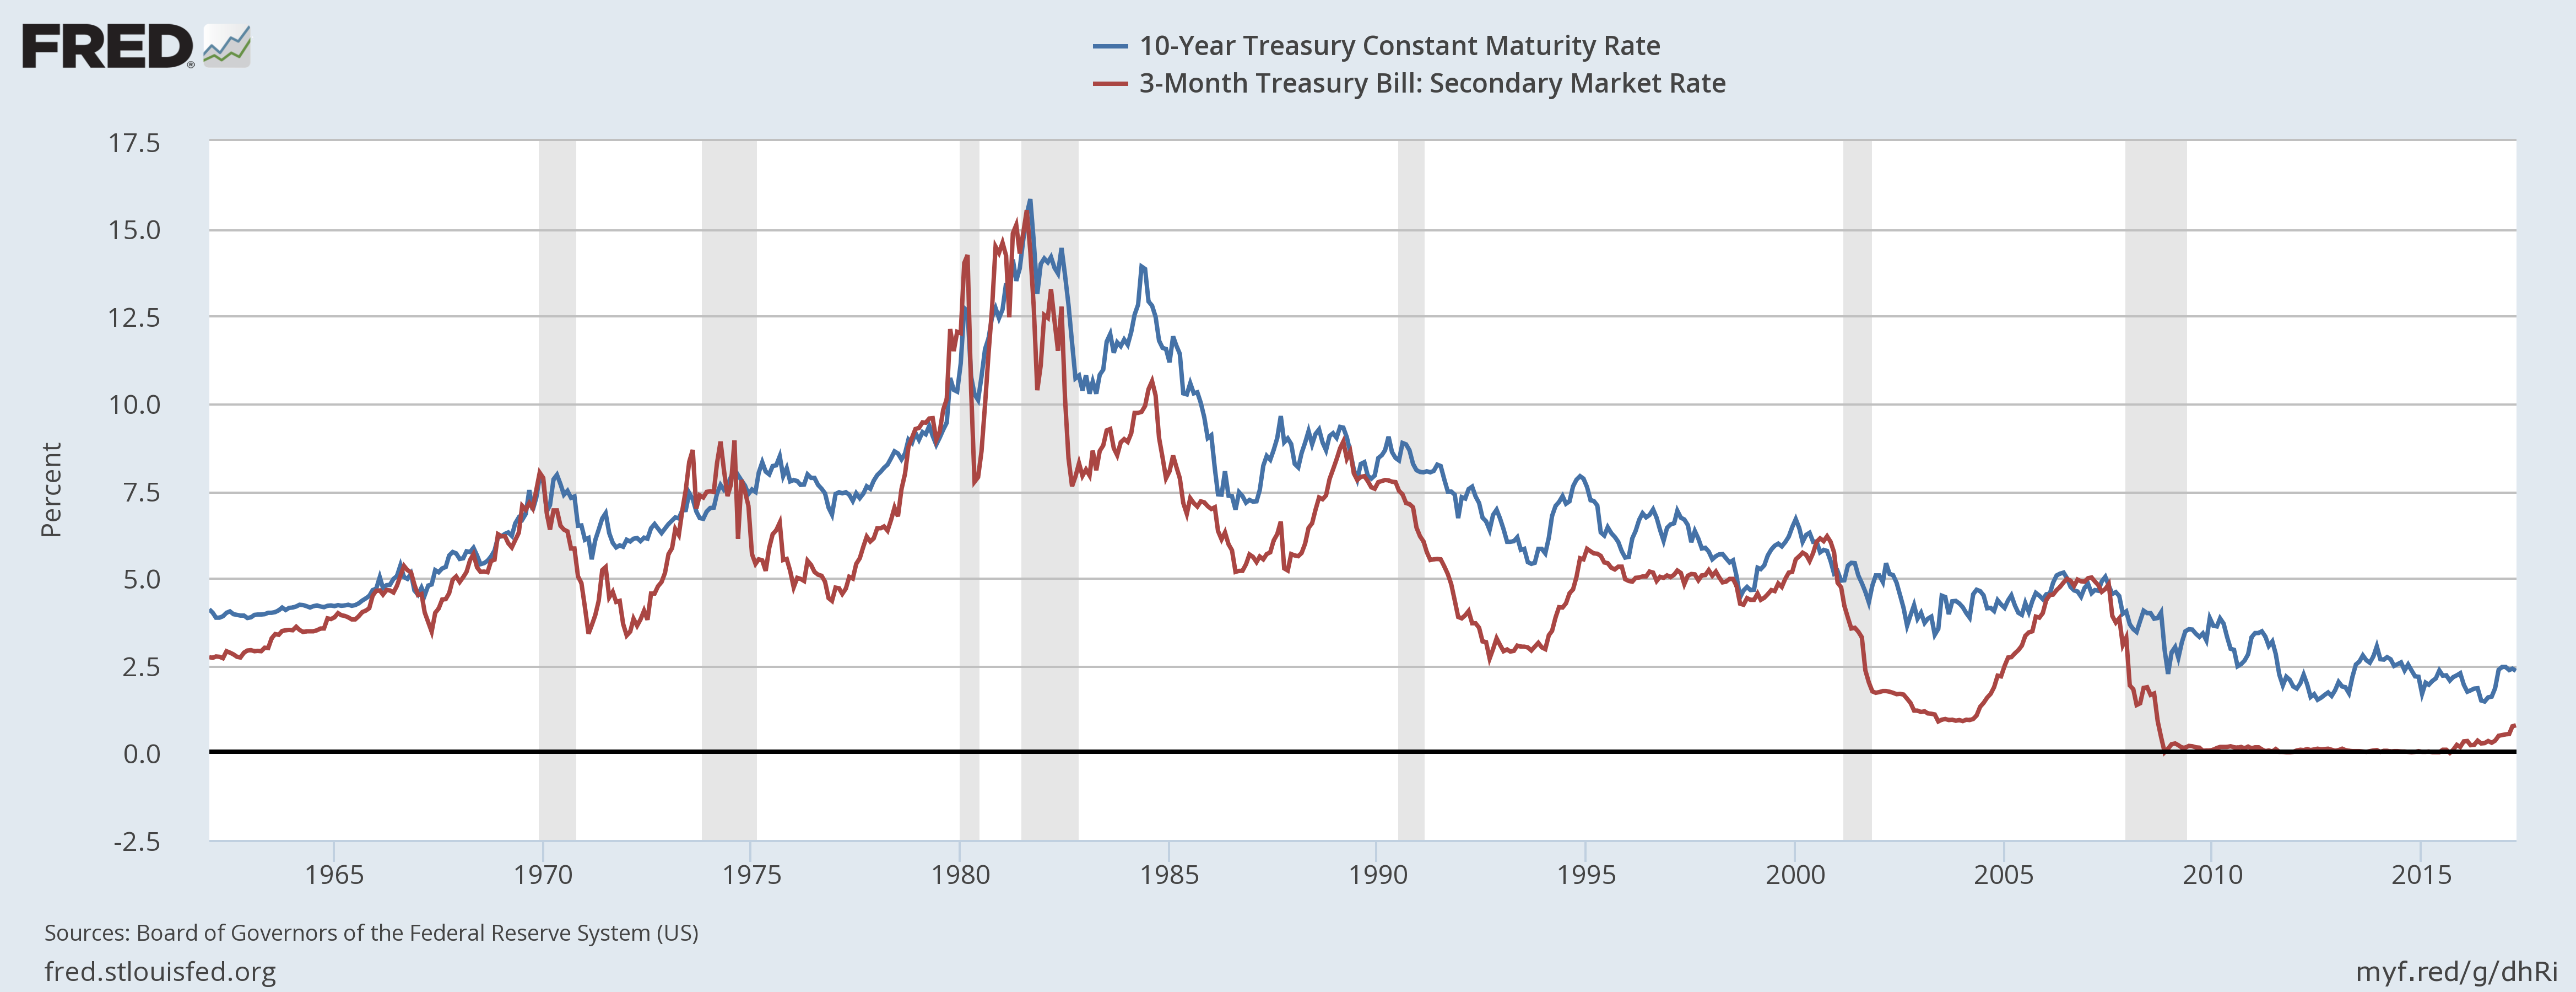
Let’s start with a long-term look at the 10-year (in blue) and 3-month (in red) yields:

Before Fed Chair Paul Volcker, the yields for both securities were increasing. But after Volcker, both began a period of decreasing rates. Just as important, note that the mid-expansion compression of the yield curve, which eventually led to an inversion signaling the end of the recession, was primarily caused by the Fed raising short-term rates. Before all other recessions save that in the early 1970s, the Fed raised short-term rates at a faster clip than longer rates, which eventually inverted the yield curve.
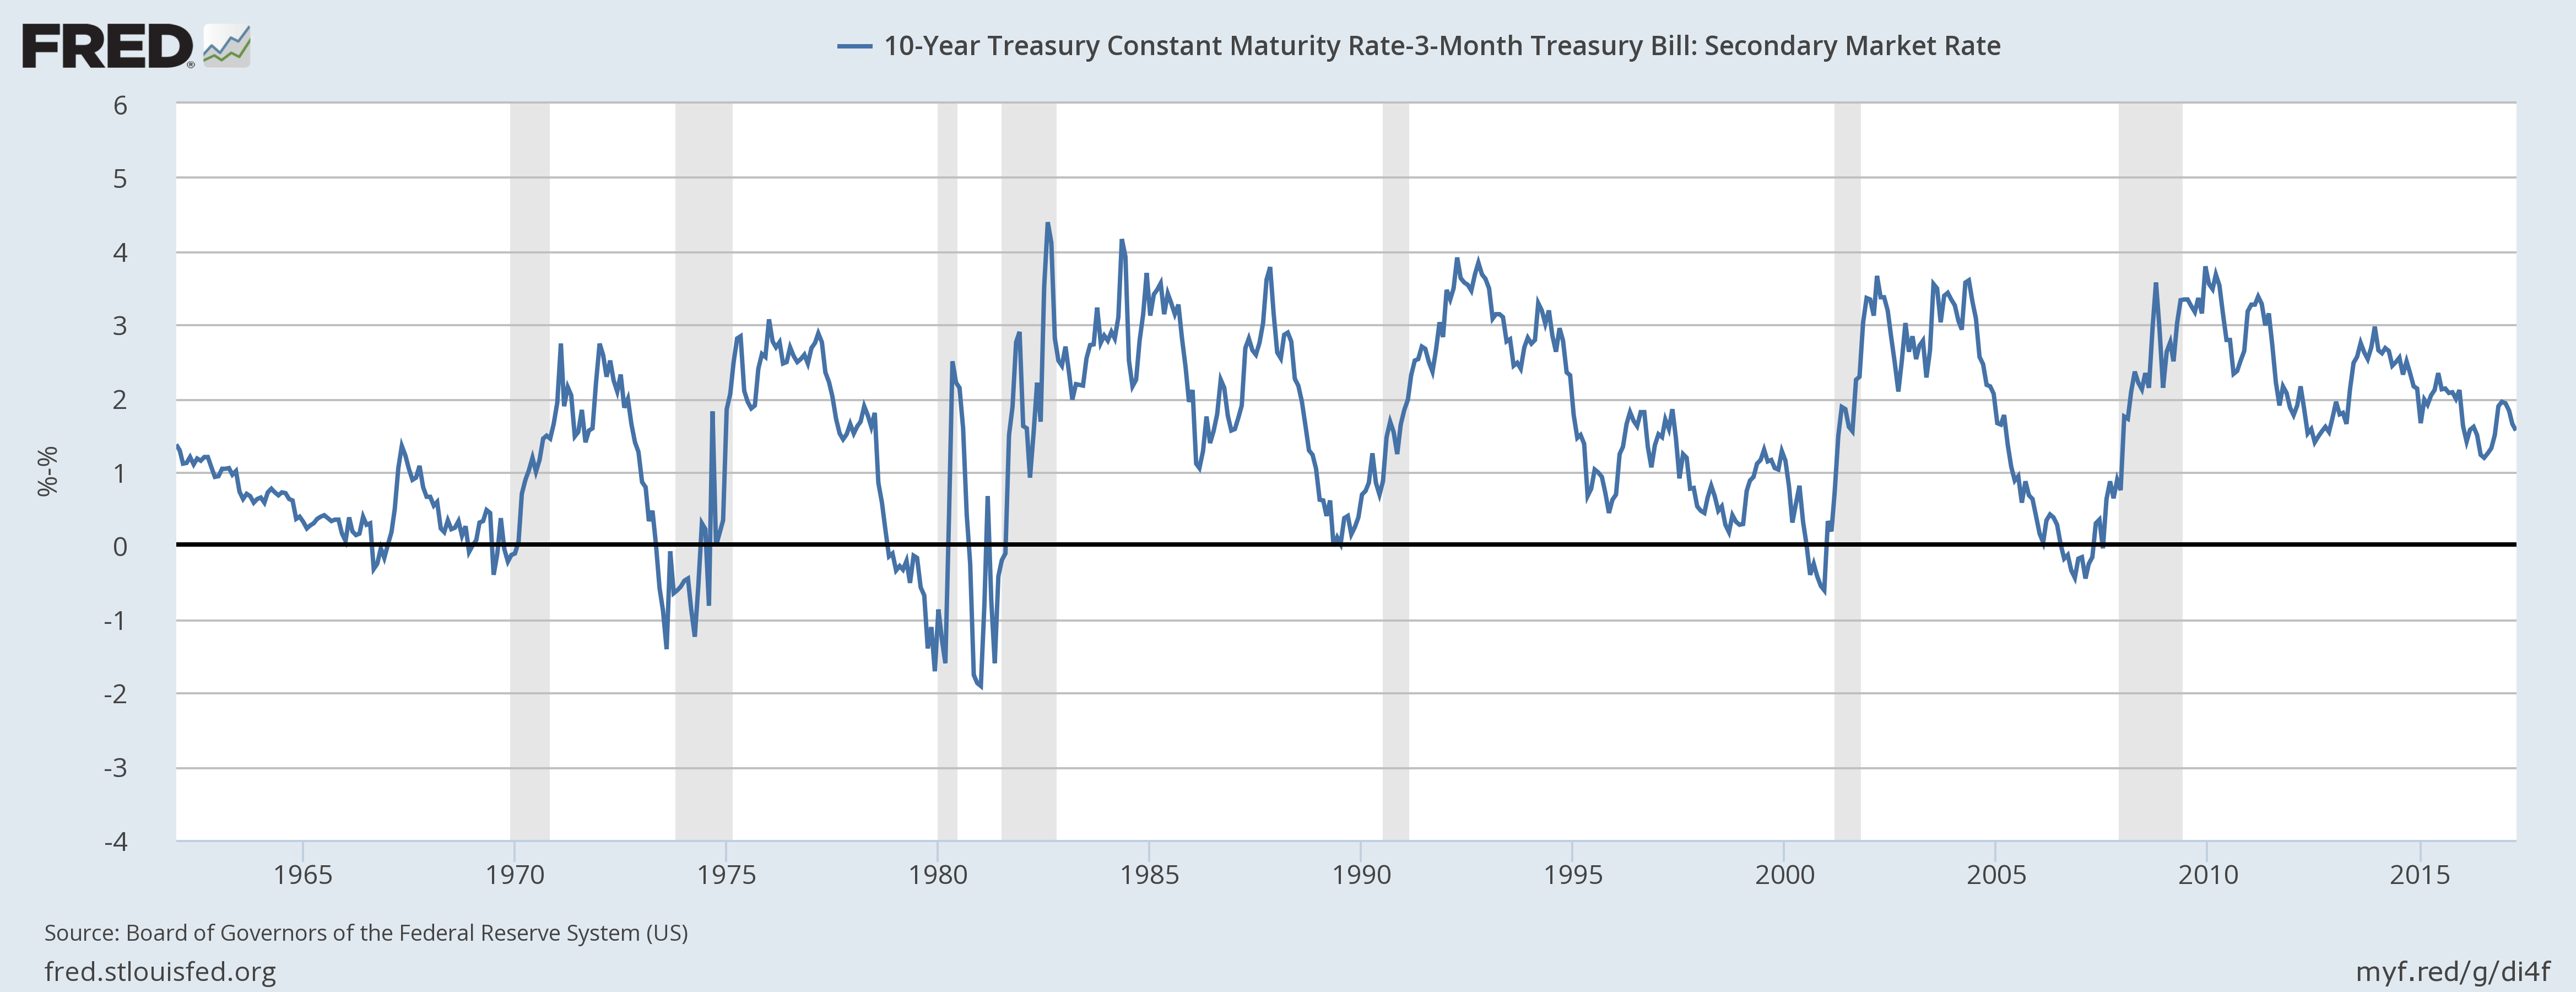
Let’s look at this information from a different perspective — the 10-year and 3-month interest-rate spread:

The chart above shows a clear narrowing — and in all but one case an inversion — of the 10-year, 3-month spread as each expansion progresses. This is econ 101: as the economy grows, the Fed raises rates primarily to lower inflationary pressure. While the Fed will usually argue they’re “taking their foot off the gas,” instead they’re “removing the punch bowl.”
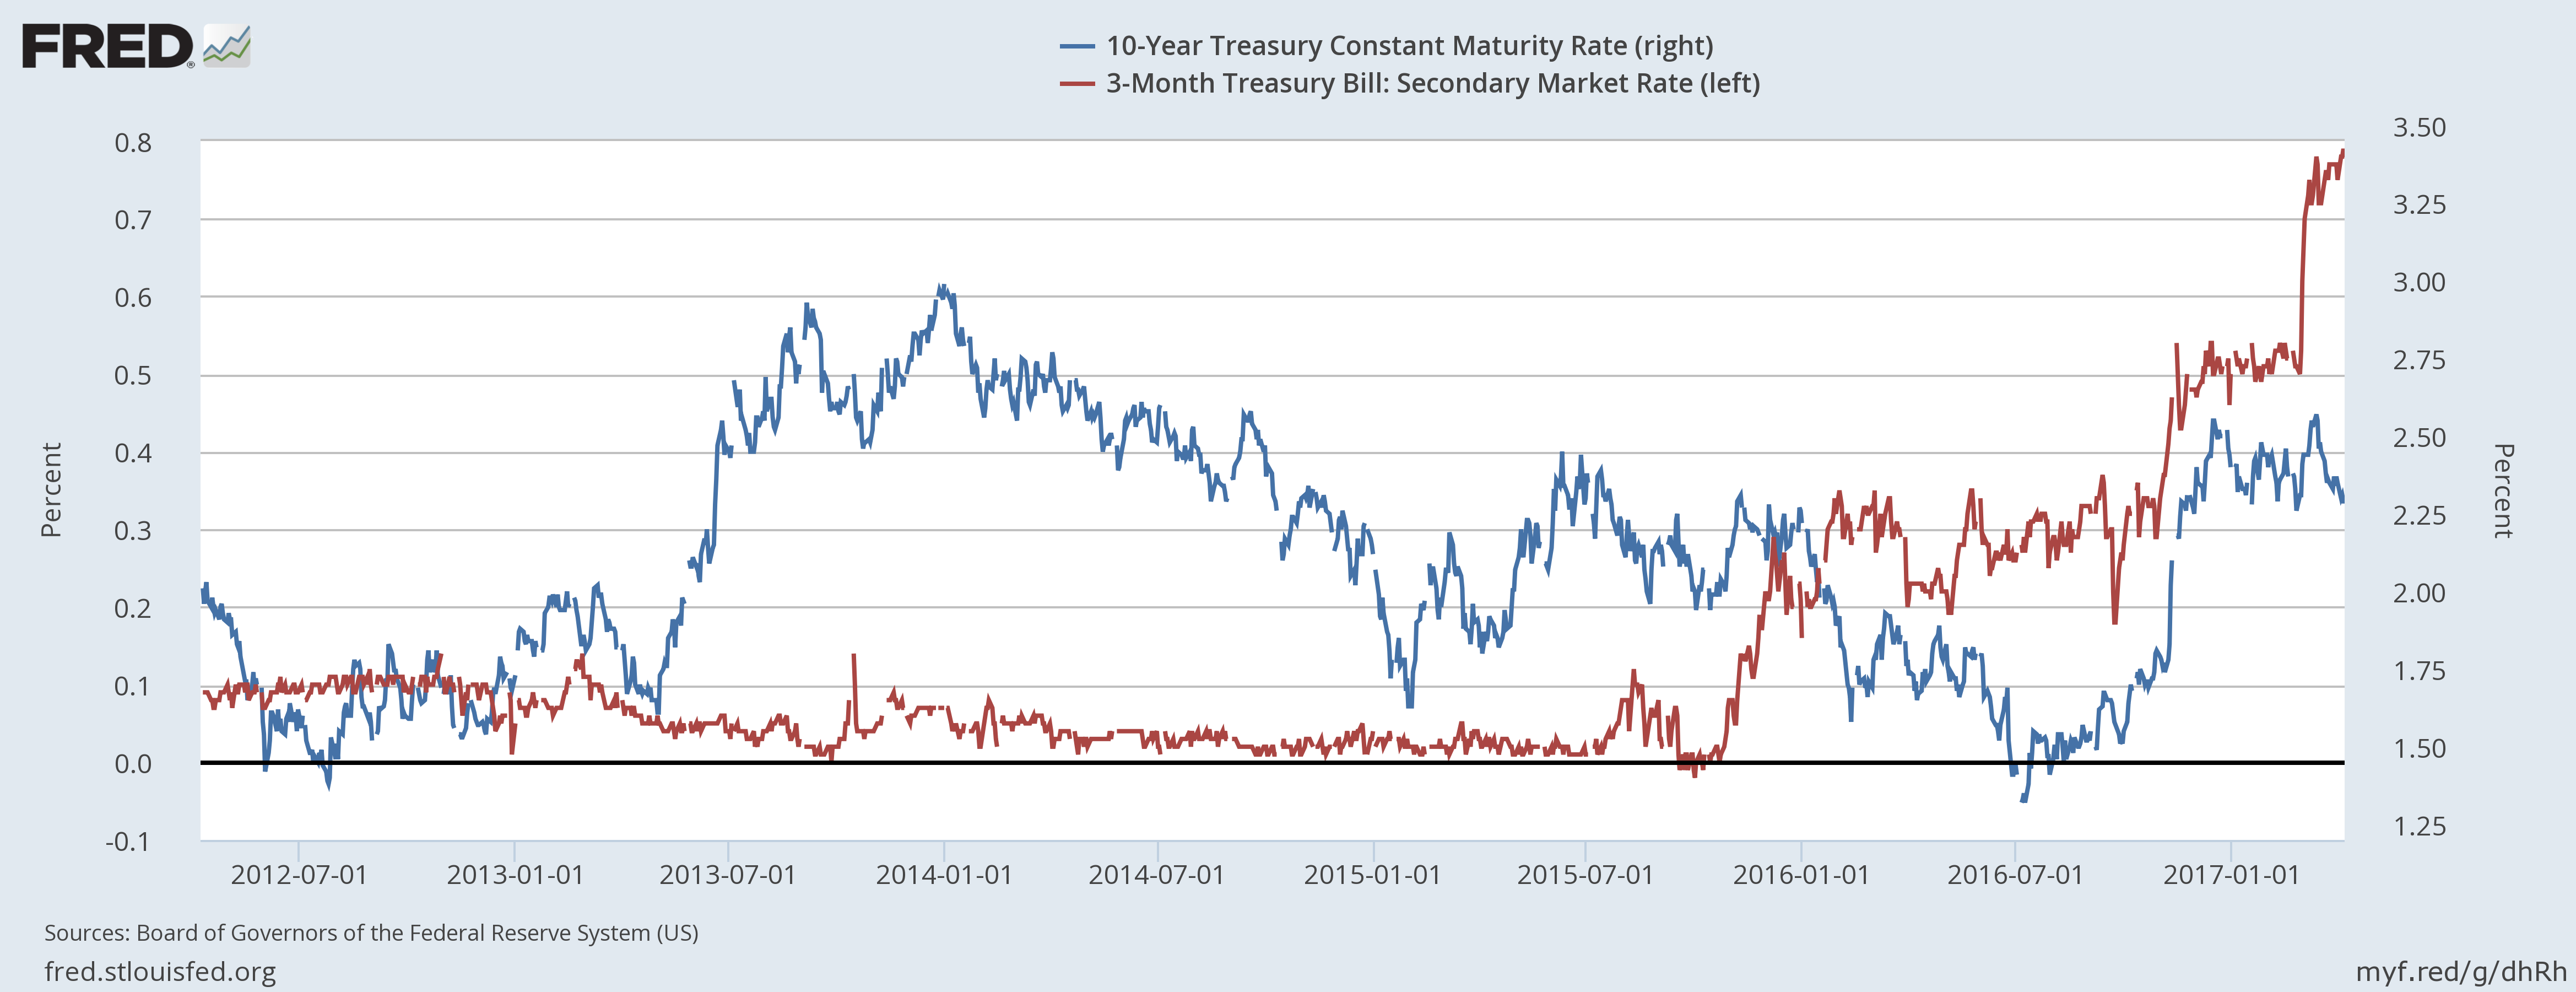
Now let’s look at a shorter time frame — the last 5 years:

Again, the blue line is the 10-year yield while the red line is the 3-month yield. Notice that, as in other expansions, it is now the increasing 3-month yield that is driving the narrowing yield curve. As the preceding chart shows, we’re still a long way from a yield-curve inversion, signaling a recession. However, initial moves by the Fed are identical to previous expansions.
As for the current picture, the latest Fed “dot plot” has shorter term interest rates rising another 50 basis points by year end. Assuming that course of action plays out, the discount rate will be 1.75 by year end. As for the longer end of the curve, the 10-year CMT rose after the election as traders, believing that the new administration would cut taxes and increase spending, increased their inflation expectations. The 10-year CMT is now about 2.3%. Assuming the 10 year remains at these levels, the 10-year, 3-month spread will compress to under 100 basis points by year end.
Hale Stewart is a tax lawyer in Houston, Texas with the Law Office of Hale Stewart, where he specializes in domestic and international tax structures and asset protection. He is also a financial adviser with Thompson Creek Wealth Advisers.
