Economic reports all across the board this morning continue to confirm a further deterioration in the overall economy. The first set of releases came overnight with Markit's Flash Purchasing Manager Indexes from around the globe - the numbers were not pretty.
Note: A reading below 50 indicates contraction.
- Japan: 47.9, down from 49.9 in June
- Netherlands: 48.9, unchanged from 48.9 in June
- South Korea: 47.2, down from 49.4 in June
- Taiwan: 47.5, down from 49.2 in June
- Vietnam: 43.6, down 46.6 in June
- China: 49.3, up from 48.2 in June
- India: 52.9, down from 55.0 in June
- Russia: 52.0, up from 51.0 in June
- Turkey: 49.4, down from 51.4 in June
- Spain: 42.3, up from 41.1 in June
- Italy: 44.3, down from 44.6 in June
- France: 43.4, down from 45.2 in June
- Germany: 43.0, down from 45.0 in June
- UK: 45.4, down from, 48.6 in June
- US: 51.4, down from 52.5 in June
Do you see the problem here?
The global economy is slowing which has been noted by several major U.S. companies as of late notably Fed Ex (FDX), UPS (UPS) and Caterpillar (CAT). Since the end of the last recession roughly 40% of corporate revenues have come from the goods and services that are exported to our global trade partners. As their economies weaken it is only a function of time before it comes home to roost.
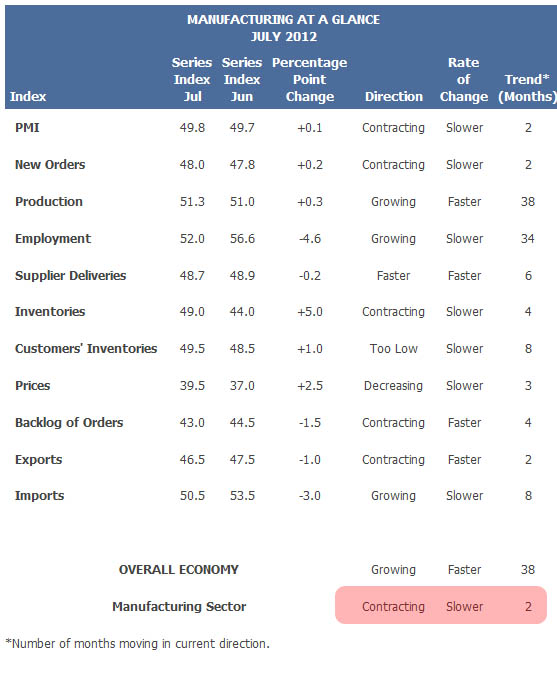
The recent release of the Institute of Supply Management (ISM) Manufacturing Index shows this occurring in real time. While the recent release showed a small uptick to 49.8 from 49.7 the lift came primarily from an unwanted build in inventories which jumped 5 points in July to 49.0 from 44.0 in June. Customer inventories also showed an increase as consumption has slowed in recent months as per our discussion yesterday. Furthermore, the increases in prices, from 37.0 in June to 39.5 in July, will likely get worse in August due to rising commodity prices. The increase in prices will have to be passed on to the consumer which is likely going to result in further contraction in spending. 
As we stated in yesterday's report the primary concern of businesses at the current time is the lack of demand or "poor sales." New Orders remain in contraction at 48 in July, Inventories are rising as stated above and Backlogs Of Orders declined to 43.0 from 44.5 in June. Exports declined to 46.5 from 4735 in June due less demand from overseas and Imports declined sharply from 53.5 to 50.5 as domestic demand has waned.
This lack of "demand" keeps business on the defensive. When New Orders fall, and Backlogs have been worked through, businesses resort to further cost cutting and productivity measures to maintain profitability. This leads to reductions in both current employment and plans for future employment as shown by the sharp drop in the Employment index from 56.6 in June to 52.0 in July.
The ISM index is not the only index to show declines in employment. Since January of 2012 the employment component of the:
- Chicago Fed National Activity Index (a composite of 85 indexes) declined from .37 to 0.00 in June.
- ISM Manufacturing Index fell from 54.30 to 52.00 in July
- ISM Non-Manufacturing Index slipped from 57.4 to 52.3 in June
- New York Fed Manufacturing Index (Empire) was 12.09 in January, rose to 20.48 in May and then plunged to 12.37 in June.
- Philadelphia Fed Manufacturing Index tumbled from 11.6 to -8.4 in July
- Dallas Fed Manufacturing Index has been sliding from its February 2012 peak of 25.2 to 11.8 in July.
- Kansas City Fed Manufacturing Index rose from 9 in January to 12 in April and crashed to 6 in July.
- Richmond Fed Manufacturing Index was climbed from 4 in January to 16 in May and then plummeted to 1 in July.
- National Federation Of Independent Businesses fell from 5 in January to 3 in June.
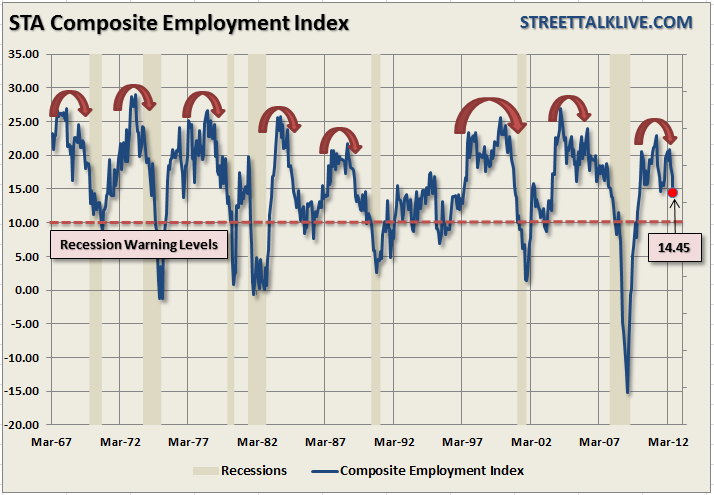
I have created a composite index of these primary employment components to get a better picture of the overall trend of employment. Historically, when this index is at 10 or below the economy has been either very weak or in recession. The index is currently at 14.45 which does not indicate an immediate recession, however, it is important to notice that declines in this index can occur very rapidly once the peak has been completed (shown by red arrows). 
Automobile manufacturing is also feeling the impact of the slow down. Both GM and Ford announced steep declines in sales. GM was expected to show a gain in July's sales of 2.1% but posted a decline of 6.4%. Ford, likewise expected to show gains of 0.8% in July, disappointed with a decline of 4%. However, this should not be news to anyone paying attention.
We have been discussing recently that the "sales" that have been reported by the manufacturers has not corresponded to retail sales reports leading us to believe that dealers were engaging in "dealer channel stuffing" allowing manufacturers to elevate sales. This is a process that can continue only temporarily until the dealers become overloaded with inventory. These types of actions skew economic reports and inflate earnings.
GM was recently served with a class-action lawsuit on allegations of channel-stuffing: "In connection with the IPO, and in order to assuage concerns that GM was predicting revenue based on production rather than actual sales, GM falsely assured investors that it was actively managing its production by monitoring its dealer inventory levels. Additionally, GM assured investors that in 2011 it would improve inventory management, which would improve average transaction price. These statements were false when made. In July 2011, reports began to surface that GM had engaged in an extraordinary inventory build-up. In particular, an article published by Bloomberg on July 5, 2011 revealed that GM may have been unloading excessive inventory on dealers, a practice known as 'channel stuffing,' in order to create the false impression that GM was recovering and sales and revenues were rising."
However, this is not isolated just to the U.S. Much has been discussed of Germany's strong economy, which as shown above is now sliding into contraction, however, Reuter's reported recently that while "official figures show a 0.7 percent rise in German car sales for the half year, figures from auto market research firms Dataforce and BDW Automotive show private demand fell 5 percent in the period, which would mean all the growth had been manufactured by the manufacturers."
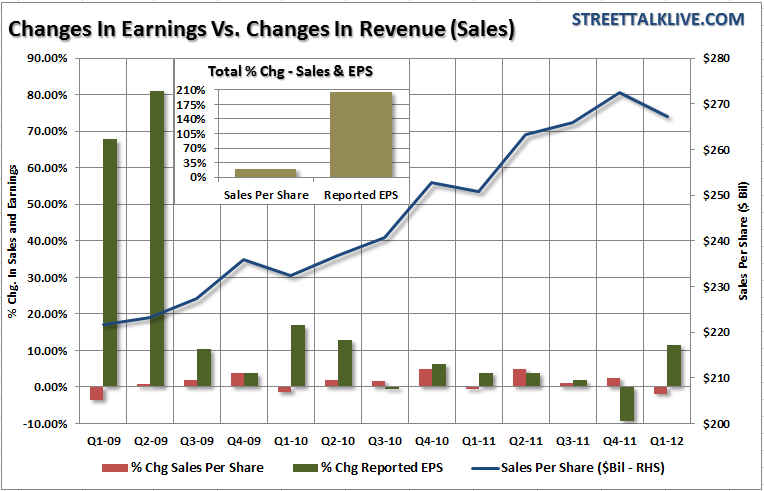
As stated above, corporations are under extreme pressure from the financial markets to make "their numbers" in terms of bottom line EPS. However, we need to pay attention to top line revenue as this is where the story of real strength is shown. Since the first quarter of 2009 top line revenue for the S&P 500 companies has increased by 21%, through the end of the first quarter of 2012, while operating profits have increased by 206%. At the same time corporate profits per employee have surged from 0.9 to 1.5 which is an all-time record. The creation of profitability has come at the expense of employment, and wages, which ultimately impacts economic growth.
However, this explains why there has only been marginal economic growth since the end of the last recession given the massive amounts of stimulus that has been thrown at the system. While corporations have gotten richer - the middle class has suffered the consequences. Since the turn of the century the average family income has fallen by 12% which is the largest sustained declined since the depression. With constrained spending power the consumer has been unable to provide the sustained demand needed to spur employment. We are currently witnessing the decline in demand in the manufacturing reports as new orders slow, backlogs are worked down and demand for employment drops.
The problem with the stimulative measures that have been applied over the last three years by the Fed is that they have acted to drag forward future demand. That "demand pull" successfully pulled, and kept, the economy out of a deeper recession since 2009, however, at the conclusion of each of these programs the vacuum created by that "demand pull" was immediately felt through the economy. We are witnessing the same effect currently. There is clear evidence that there is still insufficient demand to stimulate, and sustain, organic economic growth. Without further stimulative support the recessionary drag from the Eurozone, combined with slowing domestic demand, will continue to pull economic growth rates lower.
