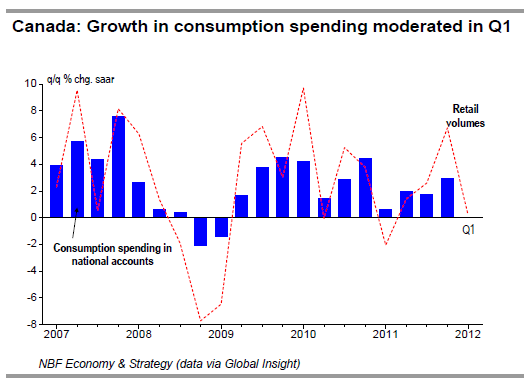
– Retail sales rose 0.4% in March helped by auto dealership revenues. Excluding autos, however, retail sales were much weaker than expected, rising just 0.1%. Gains in sales of building materials, electronics, clothing and sporting goods were largely offset by declines elsewhere, including a 1.6% drop in gasoline sales. In real terms, retail sales rose 0.4% as well. Among the provinces, Alberta continued to lead the nation with retail sales up 9% over March of last year. Even with March's advance, real retail sales in the country rose just 0.2% annualized in 2012Q1, their slowest pace since 2011Q1. This suggests consumers made a limited contribution to GDP in the quarter.
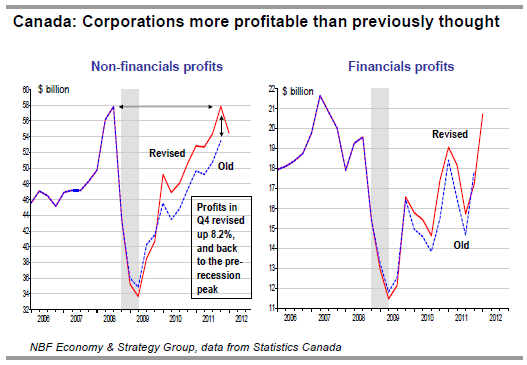
Operating profits generated at home by Canadian corporations were virtually unchanged in 2012Q1. In the non-financial sector, profits declined $3.4 billion, or 5.9%, with most of the decrease concentrated in manufacturing (-$2.6 billion) and telecoms (-$1.3 billion), where earnings recorded an outsized gain in 2011Q4. The sector’s profits in 2011Q4 were revised up 8.2% ($4.4 billion). This is remarkable in that the profits reported by the oil and gas industry were only a quarter of those registered at the prerecession peak. Hence, productivity could be revised up when the national accounts are released at the beginning of next month. As for the financial sector, profits jumped $3.5 billion in the quarter, their highest level since 2007Q3. The increase was led by life insurance companies, which registered lower actuarial liability adjustments.
The Institut de la statistique du Québec reported that Quebec real GDP at basic prices was flat in February after retreating 0.3% in January (versus -0.2% and +0.1, respectively, for Canada). Goods production edged up 0.1% in the month as higher production in the manufacturing sector offset weakness elsewhere. Output in the service sector held steady, with a decline in professional, scientific and technical services offset by a combined 0.5% gain across finance, insurance, real estate, leasing, and business. Despite the weak numbers reported for January and February, the strong December handoff still leaves Quebec on track to record real GDP growth of about 0.7% annualized in 2012Q1.
United States – Further evidence emerged that the U.S. housing market was stabilizing. Existing-home sales in April rose 3.4% to 4.62 million units, more than reversing the prior month’s decline. Both singles and multiples moved up (3% and 6%, respectively). The median sale price rose for a third consecutive month and attained its highest mark since July 2010. Despite increasing slightly, the months’ supply of homes remained near a six-year low.
Still in April, new-home sales rose 3.3% over the month before. The median new-home price rose to $235,700, up 4.9% year on year. The supply of homes at the current sales rate dropped one tick to 5.1 months. Not counting February's 4.9 print, this was the lowest inventory of homes for sale since 2005. With the supply of new homes
remaining relatively low, there is upside potential for both prices and housing starts. This explains perhaps why the NAHB builder confidence index is currently at a five-year high.
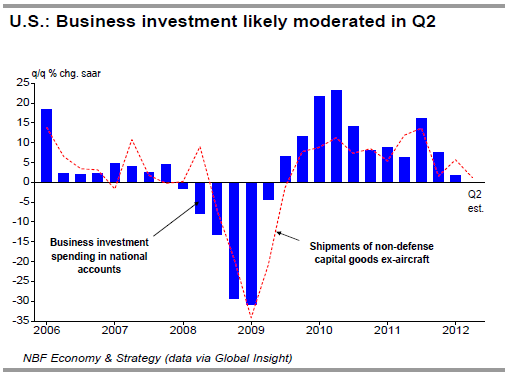
Durable goods orders rose 0.2% in April, driven by the transportation component. However, ex-transportation orders sagged 0.6%, well short of consensus expectations. Non-defence capital goods orders excluding aircraft, a gauge of future investment spending, sank 1.9% after dropping 2.2% the previous month. Total shipments of durable goods sprang 0.7% overall, but slipped 0.3% excluding transportation. Shipments of non-defence capital goods ex-aircraft fell 1.4%. This hints at a possible deceleration in investment in Q2.
Weekly initial jobless claims dipped to 370K from an upwardly revised 372K, in line with consensus. The more reliable four-week moving average fell to 370K, for a third drop in a row. Continuing claims dropped 29K to 3.26 million.
The flash/preliminary estimate of Markit's US manufacturing PMI came in at 53.9 for the month of May. Even though that's a brand new release, Markit provided historic data. So May's 53.9 print compares with April's 56 print and an average of 54.6 in Q1 and 54.3 for 2011 as a whole. Still, a reading above 50 implies expansion in manufacturing activity. In May, all of the major sub-indices (output, new orders, employment) were in expansion territory albeit a touch lower than in April. All told, the above-50 print in the PMI points to continued expansion of the US economy in Q2, although we're seeing a slight moderation.
The final read on the Michigan consumer sentiment indicator for May showed an increase to 79.3 (versus the preliminary reading of 77.8). This is the highest mark reached since October 2007. In May, consumers felt more confident about both current conditions and the economic outlook. The cycle high attained by the Michigan index is rather encouraging with respect to consumer spending. Lower gas prices may be a factor in the matter.
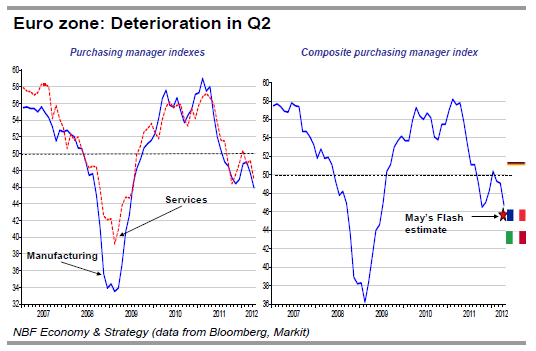
Euro zone – The news has gone from bad to worse for the euro zone, which has to contend not only with political gridlock but also a deepening recession. The Markit eurozone flash estimate for May’s purchasing managers index showed a decline to 45.9, its lowest level since mid-2009. Europe’s two powerhouses–Germany and France–saw their respective manufacturing PMIs decline sharply, which pushed them even deeper into contraction territory.
Separately, Germany’s IFO business climate index dropped sharply in May, erasing in one fell swoop all of the gains of the preceding five months.
- English (UK)
- English (India)
- English (Canada)
- English (Australia)
- English (South Africa)
- English (Philippines)
- English (Nigeria)
- Deutsch
- Español (España)
- Español (México)
- Français
- Italiano
- Nederlands
- Português (Portugal)
- Polski
- Português (Brasil)
- Русский
- Türkçe
- العربية
- Ελληνικά
- Svenska
- Suomi
- עברית
- 日本語
- 한국어
- 简体中文
- 繁體中文
- Bahasa Indonesia
- Bahasa Melayu
- ไทย
- Tiếng Việt
- हिंदी
Economic Indicators Review: May 29, 2012
Published 05/29/2012, 07:39 AM
Updated 05/14/2017, 06:45 AM
Economic Indicators Review: May 29, 2012
Canada
Latest comments
Loading next article…
Install Our App
Risk Disclosure: Trading in financial instruments and/or cryptocurrencies involves high risks including the risk of losing some, or all, of your investment amount, and may not be suitable for all investors. Prices of cryptocurrencies are extremely volatile and may be affected by external factors such as financial, regulatory or political events. Trading on margin increases the financial risks.
Before deciding to trade in financial instrument or cryptocurrencies you should be fully informed of the risks and costs associated with trading the financial markets, carefully consider your investment objectives, level of experience, and risk appetite, and seek professional advice where needed.
Fusion Media would like to remind you that the data contained in this website is not necessarily real-time nor accurate. The data and prices on the website are not necessarily provided by any market or exchange, but may be provided by market makers, and so prices may not be accurate and may differ from the actual price at any given market, meaning prices are indicative and not appropriate for trading purposes. Fusion Media and any provider of the data contained in this website will not accept liability for any loss or damage as a result of your trading, or your reliance on the information contained within this website.
It is prohibited to use, store, reproduce, display, modify, transmit or distribute the data contained in this website without the explicit prior written permission of Fusion Media and/or the data provider. All intellectual property rights are reserved by the providers and/or the exchange providing the data contained in this website.
Fusion Media may be compensated by the advertisers that appear on the website, based on your interaction with the advertisements or advertisers.
© 2007-2024 - Fusion Media Limited. All Rights Reserved.
