When we sell a covered call and share price rises dramatically, there is a tendency to roll up in order to capture additional future share appreciation. The most common reason for a gap-up in price is a favorable earnings report. In mid-May 2017 Tim wrote me about a series of trades he executed that involved a combination of these events. Let’s evaluate these trades and explore how certain headaches could have been avoided and how results could have been elevated to even higher levels.
Tim’s trades

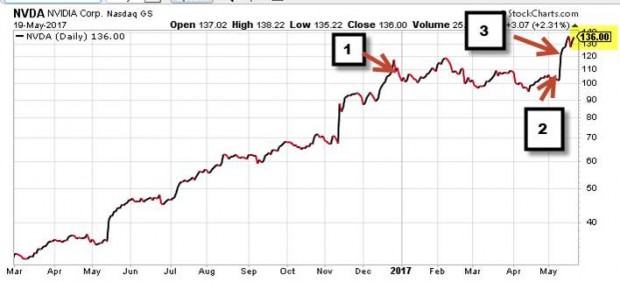
- January 2017: Buy NVDA at $110.00 (#1)
- 5/1/2017: Sell 5/$110.00 call (#2)
- 5/10/2017: Earnings report gap-up to $120.00 (#3)
- 5/10/2017: Roll up option to 6/$115.00 call (#3)
- 5/19/2017: NVDA trading at $136.00 (yellow field)
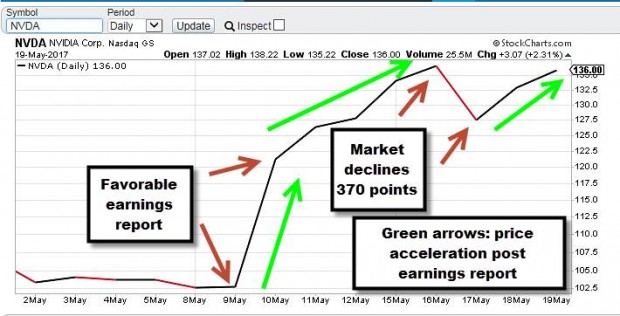
Post-earnings report price movement

- Gap-up in price after a favorable earnings report (red arrows on left)
- Price acceleration continues for 2 weeks after the report (green arrows)
- 1-day price decline as market declines by 370 points after special prosecutor named to investigate Russian connection to 2016 election (red arrows on top right)
Earnings report rule in our BCI methodology
Most of our strategy is based on guidelines that give us some flexibility. This is not the case here. We never write a call or put option when there is an earnings report due out prior to expiration.
If we have a lot of confidence in a stock that has had a favorable history of positive reports and want to hold it through the report and then write the call, that is permitted in limited circumstances. In these cases, we let the report pass and then the price settle before writing the call option.
Possible entry points after NVDA earnings reports
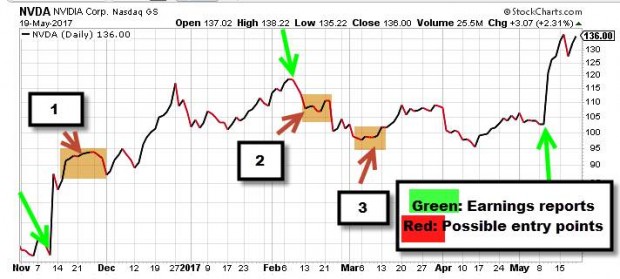
Looking back on recent earnings reports for this security the chart below shows potential entry points to sell call options post-report:

After the price reaction to the report has subsided and the stock appears in a period of consolidation, we can consider selling the call options. The green arrows show the earnings report releases and the red arrows reflect possible entry points to then sell call options.
What should Tim consider having sold the option pre-report?
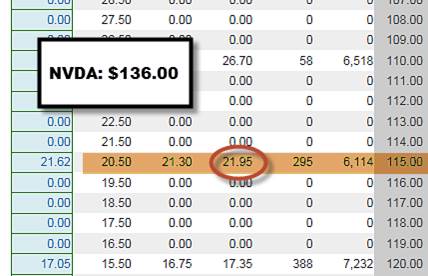
The mid-contract unwind exit strategy is our most valuable tool in these circumstances. Look for the time value component of the option premium to approach zero, making the cost-to-close negligible. In this case, the time value cost-to-close is $0.95 or 0.8%:

For more detailed information on the mid-contract unwind exit strategy:
The Complete Encyclopedia for Covered Call Writing- Classic edition: pages 264 – 271
The Complete Encyclopedia for Covered Call Writing- Volume 2: pages 243 – 252
(both editions are available in hardcover format)
Discussion
High Dividend Yield Stocks with LEAPS report
Premium members: The 4th quarter 2017 edition of this report has been uploaded to your member site. Scroll down on the left side of the premium site.
Market tone
Global stocks were little changed for the week. The Chicago Board Options Exchange Volatility Index (VIX) was flat at 9.59, and the price of West Texas Intermediate crude oil ended the week at around $50.56 a barrel. This week’s economic and international news of importance:
- On Wednesday, the US Federal Reserve announced that it would leave its benchmark interest rates unchanged but suggested that a hike is likely by the end of the year
- The Fed also announced plans to start reducing its $4.5 trillion balance sheet of Treasuries and mortgage-backed securities in October
- On Thursday, Donald Trump signed an executive order that will allow him to take action against anyone who finances and facilitates trade with the North Korea
- On Thursday, Standard and Poor’s downgraded China’s long-term sovereign credit rating from AA- to A+, following a similar downgrade by Moody’s in May
- US home resales fell 1.7% to a seasonally adjusted annual rate of 5.35 million units in August, the lowest since August 2016. A sharp decline of 25% year on year in home sales in Houston, related to Hurricane Harvey, accounted for most of the overall decline
- Central Mexico was hit with a 7.1 magnitude earthquake earlier this week, causing hundreds of buildings to collapse in Mexico City. Trading on the Mexican stock exchange was suspended following the quake.
- Top Republicans on a US Senate panel proposed a budget deal that would allow for up to $1.5 trillion in tax cuts over the next 10 years. The tax cuts would add to the current $20 trillion federal debt, which is projected to increase to about $30 trillion over the next decade
- On Thursday, the Bank of Japan announced that it will hold interest rates steady at 0.1%
THE WEEK AHEAD
Mon, Sep 25th
- None
Tue, Sep 26th
- US: new home sales
Wed, Sep 27th
- UK: House prices
- US: Durable goods orders
Thu, Sep 28th
- US: Average weekly earnings
- Japan: Consumer price index, unemployment rate
Fri, Sept 29th
- Canada: GDP
- Eurozone: CPI
- Japan: Housing starts
For the week, the S&P 500 rose by 0.08% for a year-to-date return of 11.76%
Summary
IBD: Market in confirmed uptrend
GMI: 6/6- Buy signal since market close of August 31, 2017
BCI: I am currently favoring in-the-money strikes 2-to-1.
WHAT THE BROAD MARKET INDICATORS (S&P 500 AND VIX) ARE TELLING US
The 6-month charts point to a neutral to slightly bullish outlook. In the past six months, the S&P 500 was up 6% while the VIX (10.17) moved down by 25%.
Much success to all,
