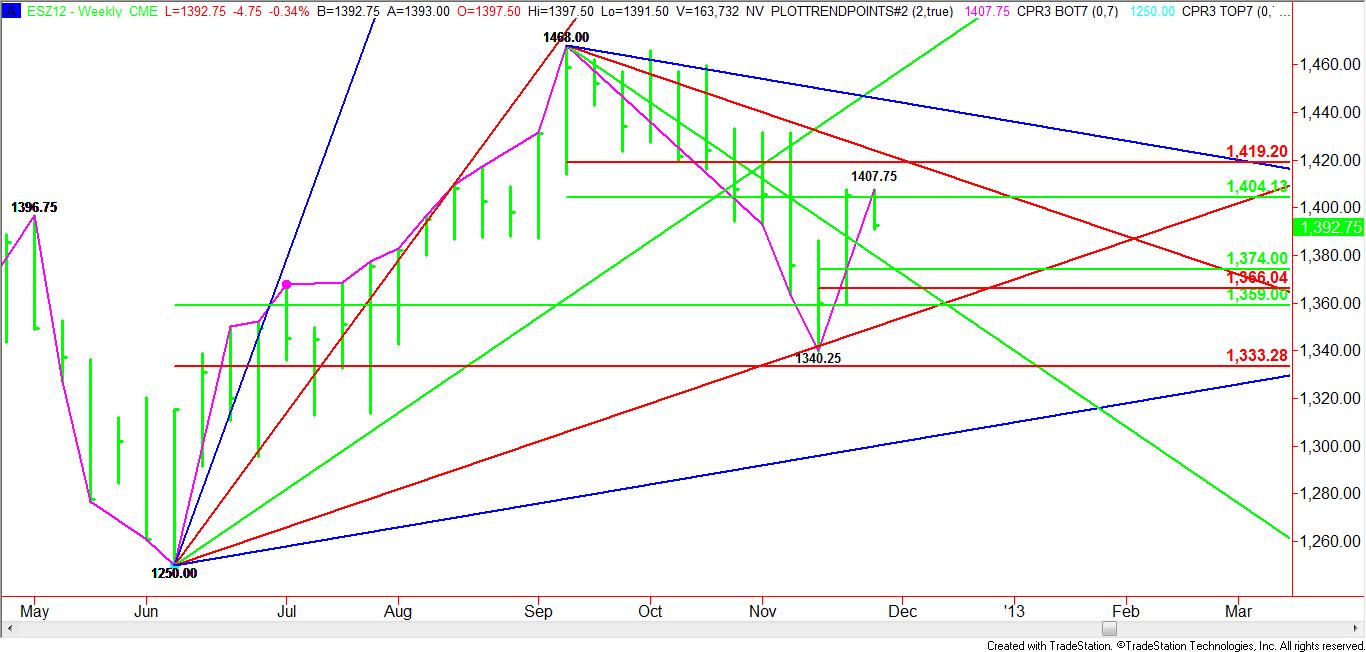
Last week the December E-mini S&P 500 futures contract completed a 50% retracement of the break from 1468.00 to 1340.25. The close over 1404.25, however, left traders a little optimistic that the rally would continue on to the Fibonacci level at 1419.25 or the downtrending Gann angle at 1424.00.
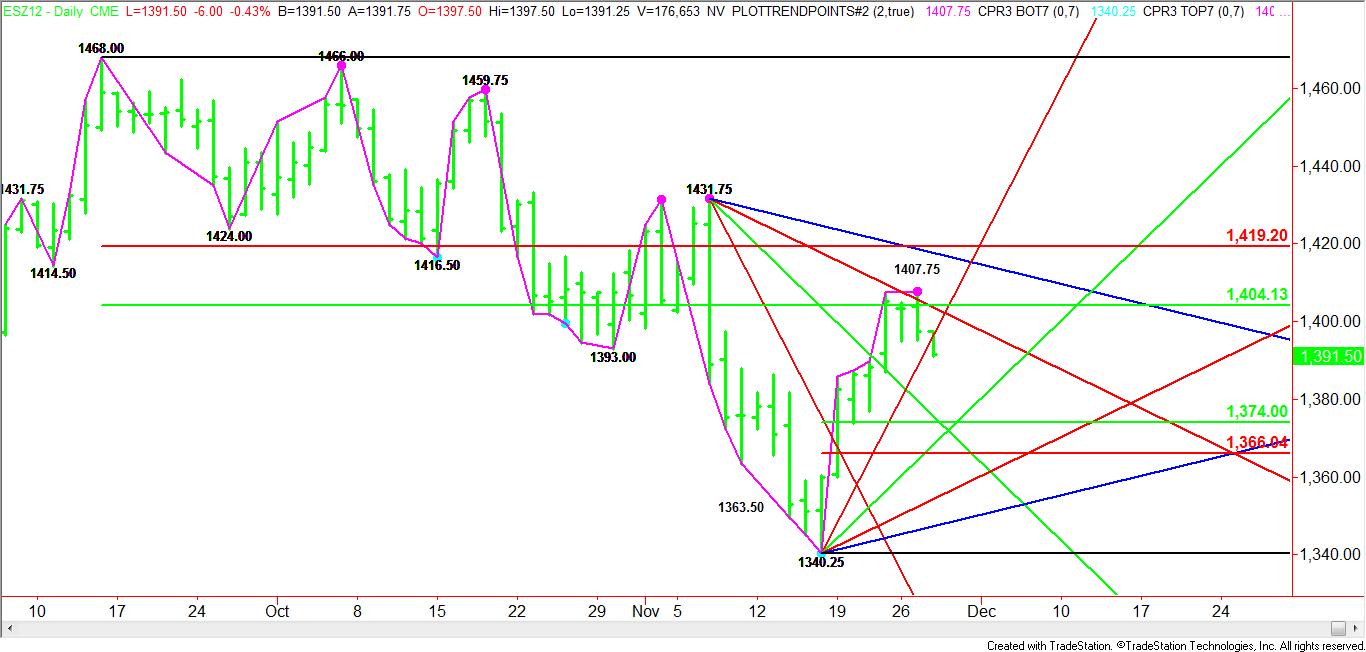
This hasn’t been the case however this week, as the market failed to generate any buying interest when it attempted to breakout over last week’s high at 1407.50. The failure at 1407.75 on Tuesday has set up the market for further downside pressure into the end of the week.
On Tuesday, the December E-mini S&P 500 formed a daily closing price reversal top. This chart pattern typically leads to a 2 to 3 day break equal to at least 50% of the last rally. Based on the short-term range of 1340.25 to 1407.75, traders should watch for a break into 1374.00 to 1366.00 over the near-term.
Last night’s follow-through to the downside and the breaking of an uptrending Gann angle at 1396.25 are two signs that the selling pressure may have started already. An uptrending Gann angle at 1368.25 is also a potential downside target today. This price forms a potential support cluster with 1366.00.
On the upside, a downtrending Gann angle at 1403.75 is the first resistance level, followed by a major 50% price level at 1404.25 and the closing price reversal top at 1407.75. A trade through this price will negate the potentially bearish chart pattern.
Fundamentally, investors are beginning to bail out of the long side of the market due to concerns about the impending fiscal cliff. An air of uncertainty has hit the market in anticipation of a drawn out negotiation process.
- English (UK)
- English (India)
- English (Canada)
- English (Australia)
- English (South Africa)
- English (Philippines)
- English (Nigeria)
- Deutsch
- Español (España)
- Español (México)
- Français
- Italiano
- Nederlands
- Português (Portugal)
- Polski
- Português (Brasil)
- Русский
- Türkçe
- العربية
- Ελληνικά
- Svenska
- Suomi
- עברית
- 日本語
- 한국어
- 简体中文
- 繁體中文
- Bahasa Indonesia
- Bahasa Melayu
- ไทย
- Tiếng Việt
- हिंदी
E-mini S&P Set Up For Near-Term Break
Published 11/29/2012, 12:50 AM
Updated 05/14/2017, 06:45 AM
E-mini S&P Set Up For Near-Term Break
3rd party Ad. Not an offer or recommendation by Investing.com. See disclosure here or
remove ads
.
Latest comments
Install Our App
Risk Disclosure: Trading in financial instruments and/or cryptocurrencies involves high risks including the risk of losing some, or all, of your investment amount, and may not be suitable for all investors. Prices of cryptocurrencies are extremely volatile and may be affected by external factors such as financial, regulatory or political events. Trading on margin increases the financial risks.
Before deciding to trade in financial instrument or cryptocurrencies you should be fully informed of the risks and costs associated with trading the financial markets, carefully consider your investment objectives, level of experience, and risk appetite, and seek professional advice where needed.
Fusion Media would like to remind you that the data contained in this website is not necessarily real-time nor accurate. The data and prices on the website are not necessarily provided by any market or exchange, but may be provided by market makers, and so prices may not be accurate and may differ from the actual price at any given market, meaning prices are indicative and not appropriate for trading purposes. Fusion Media and any provider of the data contained in this website will not accept liability for any loss or damage as a result of your trading, or your reliance on the information contained within this website.
It is prohibited to use, store, reproduce, display, modify, transmit or distribute the data contained in this website without the explicit prior written permission of Fusion Media and/or the data provider. All intellectual property rights are reserved by the providers and/or the exchange providing the data contained in this website.
Fusion Media may be compensated by the advertisers that appear on the website, based on your interaction with the advertisements or advertisers.
© 2007-2024 - Fusion Media Limited. All Rights Reserved.
