Gold and silver hit fresh record prices on rate-cut hopes, geopolitics

Dycom Industries Inc.’s (NYSE:DY) shares plummeted more than 29% on Feb 26, after the company reported lackluster fourth-quarter fiscal 2020 (ended Jan 25, 2020) results. Its bottom line not only missed the Zacks Consensus Estimate but also declined from the year-ago level. The company provided weak fiscal first-quarter guidance.
During the quarter, it reported adjusted loss of 23 cents per share, wider than the consensus estimate of 2 cents. In the year-ago quarter, the company reported earnings of 10 cents per share. Dycom highlighted that adverse weather, seasonal effects, challenges surrounding a large customer program, and a slow start at a specific customer in rolling out its new system weighed on margins in the quarter.
Revenue & Operating Highlights
Dycom’s quarterly contract revenues came in at $737.6 million, increasing 1.5% year over year. The reported figure also surpassed the consensus mark of $727.6 million by 1.4%.
Organically, revenues (excluding storm restoration services of $20.4 million in the year-ago quarter) grew 1.3% year over year in the fiscal fourth quarter. This marked the seventh consecutive quarter of organic growth. The upside was backed by higher demand from three of its top five customers owing to the deployment of 1-gigabit wireline networks, wireless/wireline converged networks and wireless networks.
The company’s top five customers contributed 77.2% to total contract revenues, decreasing 1.2% organically. Dycom’s largest customer Verizon (NYSE:VZ) accounted for 21.9% of the total revenues. Verizon grew 3.3% year over year organically. CenturyLink (NYSE:CTL) (second-largest customer) added 18.3% to total revenues and increased 31.1% organically. AT&T (NYSE:T) contributed 18% to revenues; Comcast (NASDAQ:CMCSA) accounted for 13.8%; and Windstream — representing 5.3% of the total revenues — climbed 45.9% organically. Revenues from all other customers grew 10.6% organically in the quarter.
Dycom’s backlog at the end of the reported quarter totaled $7.314 billion versus $6.349 billion at fiscal third-quarter end. Of the backlog, $2.716 billion is projected to be completed in the next 12 months.
Gross margin during the quarter was 14.2%, which was 175 basis points (bps) below the company’s expectations. Adjusted EBITDA margin also contracted 200 bps to 6% from 8% in the year-ago quarter.
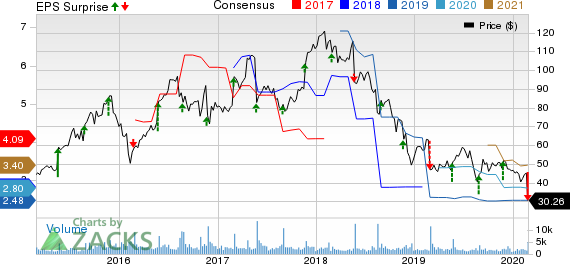
Dycom Industries, Inc. Price, Consensus and EPS Surprise
Dycom Industries, Inc. price-consensus-eps-surprise-chart | Dycom Industries, Inc. Quote
Financials
As of Jan 25, 2020, Dycom had cash and cash equivalents of $54.6 million compared with $128.3 million on Jan 26, 2019. Long-term debt was $844.4 million at the end of fiscal 2020 compared with $867.6 million at fiscal 2019-end.
First-Quarter Fiscal 2021 Guidance
The company anticipates contract revenues in the range of $730-$780 million, lower than the Zacks Consensus Estimate of $799 million. The said range also indicates a decline from the year-ago figure of $833.7 million.
Bottom line (on an adjusted basis) is expected within a loss of 9 cents to earnings of 8 cents per share. The estimated range is below the current consensus mark of earnings of 30 cents per share for the quarter. Also, the said range suggests a decline from the prior-year reported earnings of 53 cents per share.
Zacks Rank & Stocks to Consider
Dycom currently carries a Zacks Rank #3 (Hold). Some better-ranked stocks in the same space include Great Lakes Dredge & Dock Corporation (NASDAQ:GLDD) , Orion Group Holdings, Inc. (NYSE:ORN) , and EMCOR Group, Inc. (NYSE:EME) . While Great Lakes Dredge & Dock sports a Zacks Rank #1 (Strong Buy), Orion Group Holdings and EMCOR carry a Zacks Rank #2 (Buy). You can see the complete list of today’s Zacks #1 Rank stocks here.
Great Lakes Dredge & Dock surpassed the Zacks Consensus Estimate in the last four quarters, with an average positive surprise of 119.8%.
Orion Group Holdings’ earnings for 2020 are expected to increase 211.8%.
EMCOR topped the consensus mark in all the trailing four quarters, with the average being 10.2%.
Today's Best Stocks from Zacks
Would you like to see the updated picks from our best market-beating strategies? From 2017 through 2019, while the S&P 500 gained and impressive +53.6%, five of our strategies returned +65.8%, +97.1%, +118.0%, +175.7% and even +186.7%.
This outperformance has not just been a recent phenomenon. From 2000 – 2019, while the S&P averaged +6.0% per year, our top strategies averaged up to +54.7% per year.
See their latest picks free >>
EMCOR Group, Inc. (EME): Free Stock Analysis Report
Orion Group Holdings, Inc. (ORN): Free Stock Analysis Report
Great Lakes Dredge & Dock Corporation (GLDD): Free Stock Analysis Report
Dycom Industries, Inc. (DY): Free Stock Analysis Report
Original post
Zacks Investment Research