
The British pound is finding some strength against the dollar on Thursday, after falling to a 21/2 year low. However, concerns still remain amongst investors whether this strength has any reality, given that the country is on the verge of a third recession. There is no shortness in a string of sluggish outlook for Great Britain as its credit rating was downgraded last month. Economic manufacturing data released on Tuesday showed further weakness for the British economy.
 GBP/USD H1" title="GBP/USD H1" width="1432" height="794">
Most analysts believe that traders could be building large positions before Finance Minister George Osborne presents his budget on March 20. It is also widely expected that the BOE could soon unravel another round of quantitative easing program.
Technical Analysis
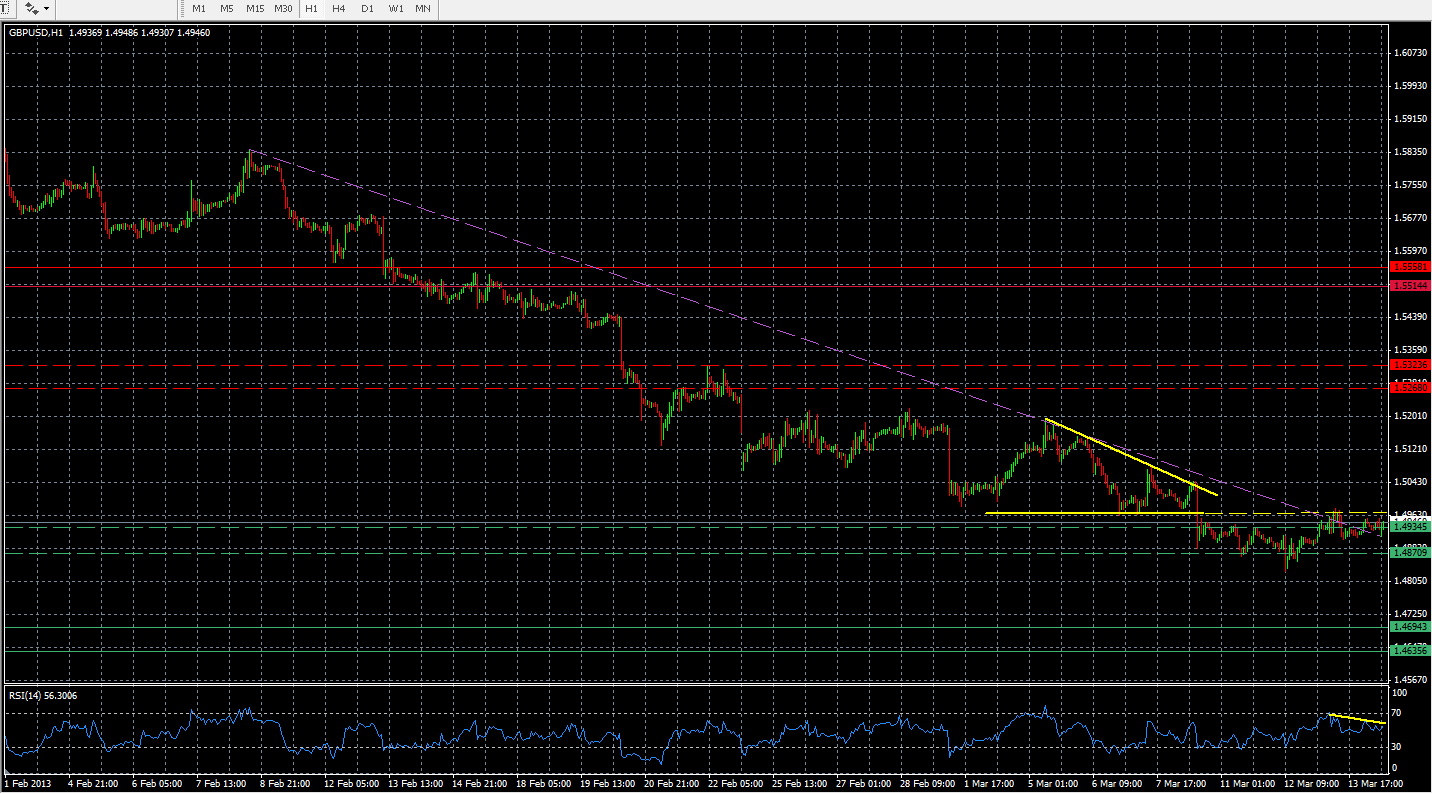
Since the GBP/USD pair has broken out of its ascending triangle, it is unable to break above the lower line of this triangle hown with the dotted yellow line. This means still a lot of weakness for the GBP/USD. Moreover, the price action was also able to break its support level of 1.4934-1.4870, which further strengthens this argument.
However, it is also important to state that we are forming a reverse complex Head & Shoulder pattern at the moment, and if it does play out, it could push the price action towards the minor resistance level of 1.5077 before it continues its downward trend any further.
The RSI is showing a clear sign of deflection, which means bias could be towards the downward.
Important Zones
Support Zones
1.4695-1.4635 (Major)
1.4934-1.4870 (Minor)
Resistance Zone
1.5323-1.5268 (Minor)
1.5558-1.5514 (Major)
DISCLOSURE & DISCLAIMER: The Above Is For Informational Purposes Only, And Not To Be Construed As Specific Trading Advice. Responsibility For Trade Decisions Is Solely With The Reader.
by Naeem Aslam
- English (UK)
- English (India)
- English (Canada)
- English (Australia)
- English (South Africa)
- English (Philippines)
- English (Nigeria)
- Deutsch
- Español (España)
- Español (México)
- Français
- Italiano
- Nederlands
- Português (Portugal)
- Polski
- Português (Brasil)
- Русский
- Türkçe
- العربية
- Ελληνικά
- Svenska
- Suomi
- עברית
- 日本語
- 한국어
- 简体中文
- 繁體中文
- Bahasa Indonesia
- Bahasa Melayu
- ไทย
- Tiếng Việt
- हिंदी
Downward Trend Still Strong For GBP/USD
Published 03/14/2013, 08:29 AM
Updated 02/02/2022, 05:40 AM
Downward Trend Still Strong For GBP/USD
Fundamental Analysis
Latest comments
Loading next article…
Install Our App
Risk Disclosure: Trading in financial instruments and/or cryptocurrencies involves high risks including the risk of losing some, or all, of your investment amount, and may not be suitable for all investors. Prices of cryptocurrencies are extremely volatile and may be affected by external factors such as financial, regulatory or political events. Trading on margin increases the financial risks.
Before deciding to trade in financial instrument or cryptocurrencies you should be fully informed of the risks and costs associated with trading the financial markets, carefully consider your investment objectives, level of experience, and risk appetite, and seek professional advice where needed.
Fusion Media would like to remind you that the data contained in this website is not necessarily real-time nor accurate. The data and prices on the website are not necessarily provided by any market or exchange, but may be provided by market makers, and so prices may not be accurate and may differ from the actual price at any given market, meaning prices are indicative and not appropriate for trading purposes. Fusion Media and any provider of the data contained in this website will not accept liability for any loss or damage as a result of your trading, or your reliance on the information contained within this website.
It is prohibited to use, store, reproduce, display, modify, transmit or distribute the data contained in this website without the explicit prior written permission of Fusion Media and/or the data provider. All intellectual property rights are reserved by the providers and/or the exchange providing the data contained in this website.
Fusion Media may be compensated by the advertisers that appear on the website, based on your interaction with the advertisements or advertisers.
© 2007-2024 - Fusion Media Limited. All Rights Reserved.