Get 40% Off
🎁 Free Gift Friday: Copy Legendary Investors' Portfolios in One ClickCopy for Free

Dow Jones E-Mini Futures Tag 30k Twice – Setting Up Double Top

Published 11/17/2020, 02:20 PM
Updated 07/09/2023, 06:31 AM

Sometimes the markets telegraph a key level or future target level in pre-market or post-market trading. Other times these telegraphed price targets happen during regular trading hours. Recently, the Dow Jones E-Mini Futures Contracts (YM) generated two unique high price levels near $30,000 over the span of about six trading days.

My research team and I believe this “telegraphed high price target level” is a warning of major resistance for traders. These types of broad market patterns are not very common on charts. They happen sometimes, but very rarely like this example on the YM chart below. This Double Top (Tweezers) pattern may be warning that the $30,000 level on the YM could become a major market peak/turning point. Additionally, the post-election rally reached this $30,000 level on the day Pfizer (NYSE:PFE) announced the vaccine data, then sold off quite consistently throughout the regular trading session.

Tweezer Tops Near $30,000 Warn Of Strong Resistance

Obviously, traders are attempting to redeploy capital into sectors they believe present real opportunities for growth and appreciation.  As we can see from the chart below, the Dow Jones and Mid-Cap sectors appear to be the leading sectors at the moment. We're not calling for a major top in the market based on this pattern (yet).  We are just bringing it to your attention so you can be aware of the resistance level that appears to have setup near $30,000 on the YM.
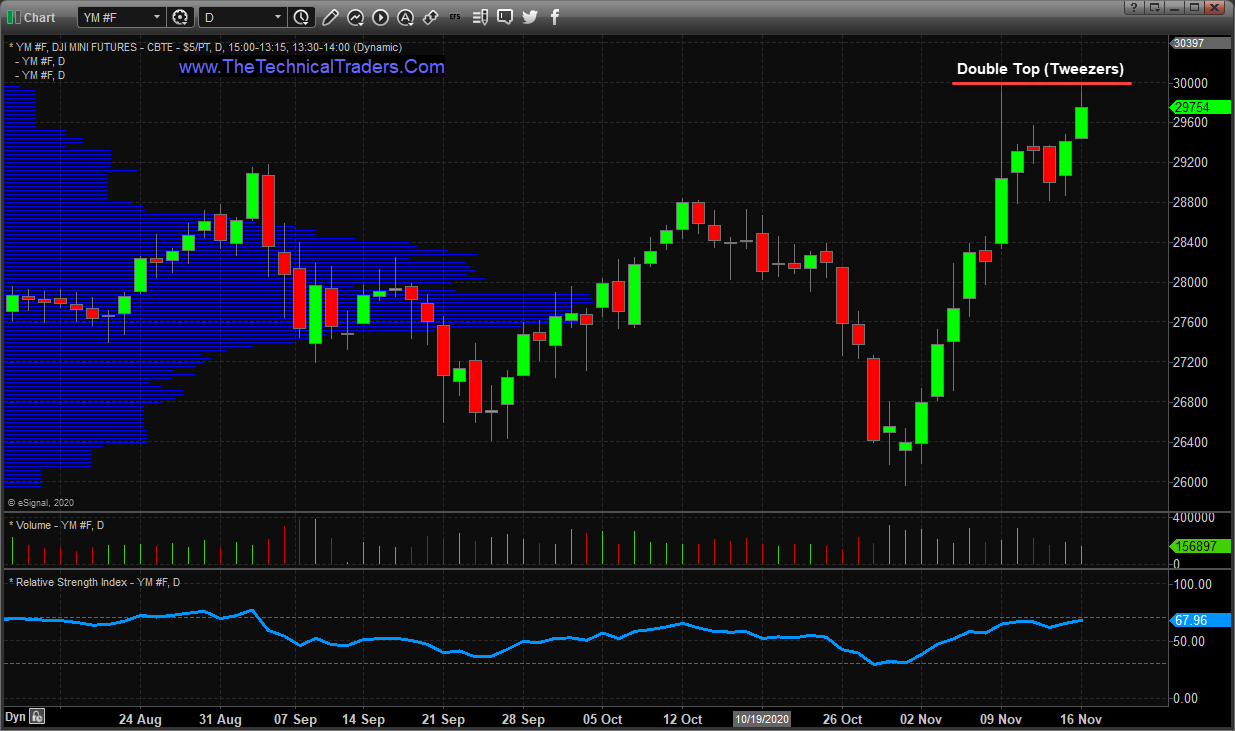
Dow Jones E-Minis Daily Chart.

The market could blow through this $30,000 level and continue to rally higher or it could stall near the $30,000 level and retrace lower. Given the situation with the U.S. election and the surging COVID-19 cases throughout the world, it doesn't take much of an imagination to consider another shutdown related market decline setting up.

3rd party Ad. Not an offer or recommendation by Investing.com. See disclosure here or remove ads .

If you read our recent article about the U.S. stock market and gold price appreciation/depreciation phases, you will see how my team believes the U.S. stock market entered a depreciation phase in mid-2018 and the current rally in the markets (2019 till now) is an excess phase “blow off” rally in the works. If our research is correct, we expect the excess phase to end at some point in the near future, setting up a broad market correction and/or broad sideways rotation. In the meantime, the rally appears to continue with a near-term target of $30,000 (only 250 points away). 

Latest comments

I totally agree with you.. considering Tax cut and the US economy the rally from Trump inauguration till the first half of 2018 was moderate. but the rally until Feb 2019 was a bit over ***  because of this overshooting and Thanks to the big hands there has been big drop which has gone to much .... and that also triggered a big irrational rebound with the help of greedy whales and reckless retail investors who has no fear buying Nio ADR at over 45, Tesla at over 2500 before split. IMAO,10% for Dow 15% for Nasdaq are minimum expected correction and dips could be 20 ~ 30 % in case, but still it depends on the big whales intention as well.
Incredibly insightful....I think anyone could look at that chart and say the market might go up or down depending on the situation
if you attack tomorrow, gread army will fall. after sun comes water etc....
Excellent looks beautiful double top, I have down side correction of 20% just around bear territory. December is tank month it’s all going to tank ! Cash is king 👑
dont be surprise. it might be another leg up.
  its been up like double in six months from 18 to 30, will correct to 22
Risk Disclosure: Trading in financial instruments and/or cryptocurrencies involves high risks including the risk of losing some, or all, of your investment amount, and may not be suitable for all investors. Prices of cryptocurrencies are extremely volatile and may be affected by external factors such as financial, regulatory or political events. Trading on margin increases the financial risks.
Before deciding to trade in financial instrument or cryptocurrencies you should be fully informed of the risks and costs associated with trading the financial markets, carefully consider your investment objectives, level of experience, and risk appetite, and seek professional advice where needed.
Fusion Media would like to remind you that the data contained in this website is not necessarily real-time nor accurate. The data and prices on the website are not necessarily provided by any market or exchange, but may be provided by market makers, and so prices may not be accurate and may differ from the actual price at any given market, meaning prices are indicative and not appropriate for trading purposes. Fusion Media and any provider of the data contained in this website will not accept liability for any loss or damage as a result of your trading, or your reliance on the information contained within this website.
It is prohibited to use, store, reproduce, display, modify, transmit or distribute the data contained in this website without the explicit prior written permission of Fusion Media and/or the data provider. All intellectual property rights are reserved by the providers and/or the exchange providing the data contained in this website.
Fusion Media may be compensated by the advertisers that appear on the website, based on your interaction with the advertisements or advertisers.
© 2007-2024 - Fusion Media Limited. All Rights Reserved.