Just recently, CNBC ran an article touting the call of “Billionaire Investor Ron Baron” of the Dow reaching 650,000 in just 50-years.
As noted in the article:
Speaking from his annual investment conference in New York, Baron predicted the Dow Jones Industrial Average, based on historical moves over decades, will reach 650,000 in 50 years, with an over $500 trillion U.S. economy.
Doing some quick math, that assumption is for a 6.6% annualized return on both the Dow and the U.S. economy, as noted by Ben Carlson.
Here is the chart to prove it:

Both are innocuous tweets, meant with the best of intentions to leave you with a sense of optimism about your financial future.
I get it. Really.
As Bob Farrell once quipped:
Bull markets are more fun than bear markets.
Here is the problem.
It’s complete bulls*** on both counts.
Mr. Baron, as noted, was speaking at his “buy and hold” conference, and the tweet was meant to both grab attention and headlines.
It worked.
The problem with being “bullish all the time” is that it is also very dangerous.
This is particularly the case in late-stage “bull markets,” where poor investment decisions, and excessive portfolio “risk,” are masked by seemingly ever-rising prices. Previously bad investment ideas, products, and strategies tend to resurface in a different form or package. Investment strategies like “buy and hold” and “dollar cost averaging” become popular even though they are absolutely guaranteed to leave you well short of your financial objectives in the future.
So, what does this have to do with CNBC’s article?
It has everything to do with one of my “pet peeves,” and the biggest fallacy pushed by Wall Street today – “compound returns.”
Markets/Economies Don’t Compound
Let’s start with the economy.
The economy hasn’t seen an annualized growth rate of 6% since the 1950’s when the U.S. was the manufacturing hub of the entire world. Following WWII, the majority of Europe, and Japan following two nuclear bombs, were devastated. Today, the U.S. is no longer a manufacturing hub, but a services provider for ever-lower costs. Services, as compared to manufacturing, has a very low economic multiplier effect. Given $22 Trillion in debt and climbing, the attainment of a 6% growth rate is not a possibility.
The chart below pretty much details the problem.
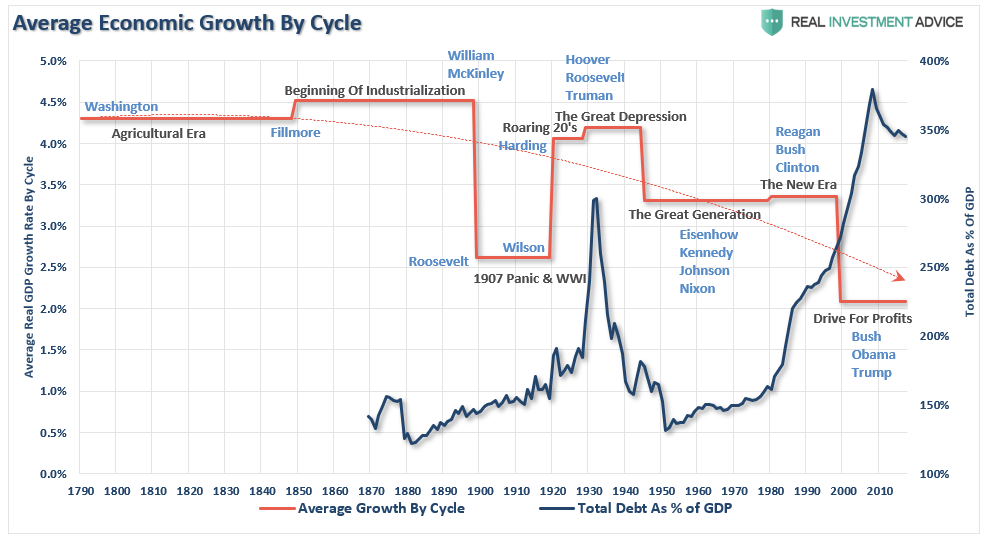
It is often stated the U.S. economy has grown by more than 6% on average over the long-term. (This is a true statement) However, it is also a very misleading statement. Average and actual growth are two very different things.
If we go back to 1901 and assume the economy grew at 6.6% annualized, as Mr. Baron suggests will happen in the future, the economy would currently be roughly $852 trillion in value, rather than just a paltry $19 trillion.
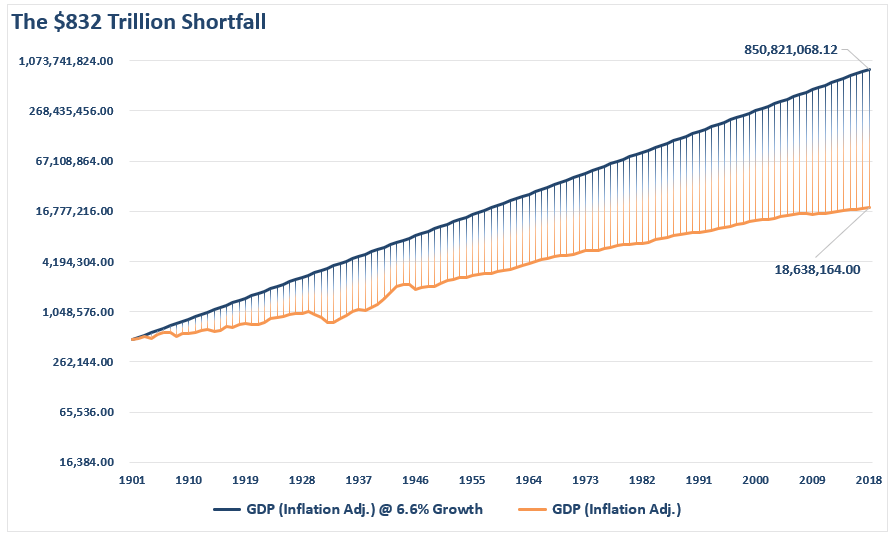
What happened?
A lot of years of very low, or negative, economic growth.
The same thing holds true with the Dow.
As noted, Mr. Baron suggests the Dow will be valued at 650,000 in the next 50-years. So clearly, as a young investor you should just sock all your hard-earned savings into an “index fund” and hang on.
“The stock market is literally the same thing as a high-yield savings account.” – Jim J. (names have been changed to protect the stupid.)
Here’s the thing.
It has often been stated the markets have had an average annual return of 8-10% depending on who you ask. If we just assume the Dow had compounded at just 5% since 1901, we would already be at 650,000.
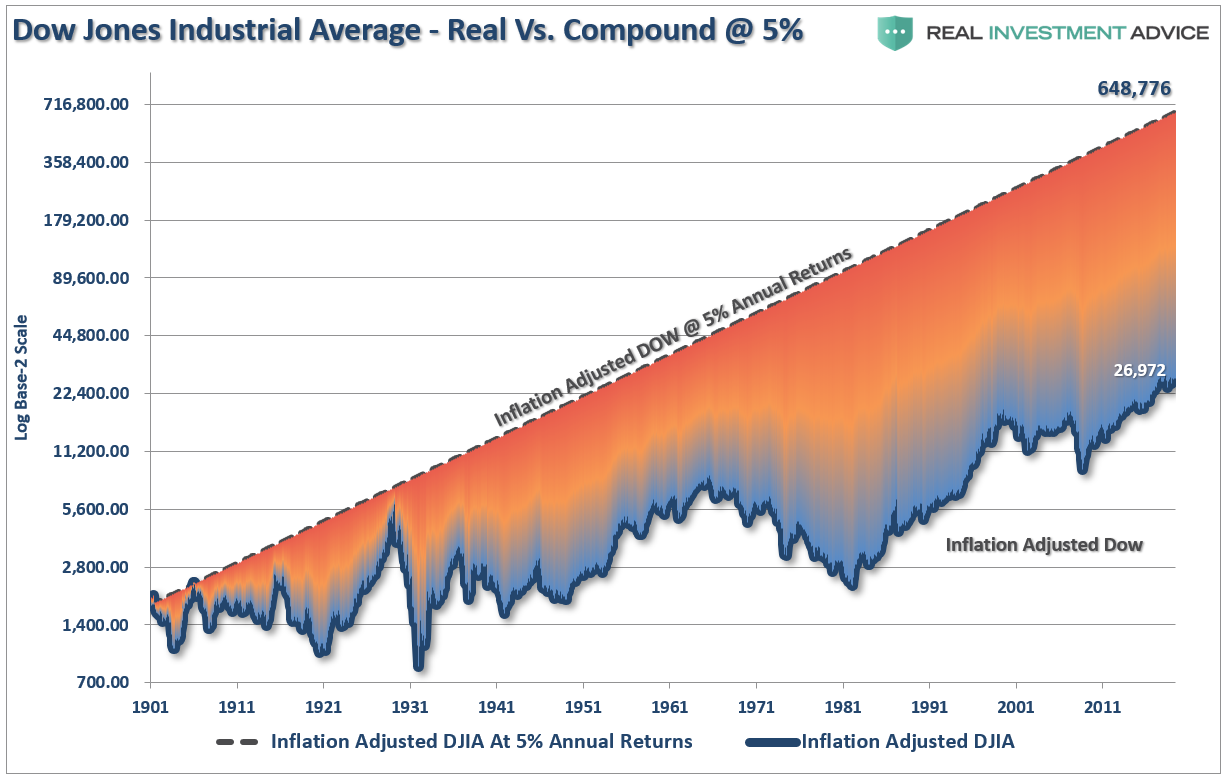
But it’s not.
We are just stuck here at a “crappy ole’ 27,000.”
There is a huge difference between compound returns and average returns. The historical performance of the markets since 1900, including dividends, has averaged a much higher rate of return than just 5% annually. Therefore, the Dow should actually be much closer to 1,000,000 than 650,000.
Again, it’s not.
Nope…we are just hanging out way down here at 27,000.
Why? Because crashes matter. This is particularly the case when it comes to your financial goals and investing time horizons.
Think about it this way.
If “buy and hold” investing worked the way that it is preached, then why are the financial statistics of 80% of Americans so poor?
The three biggest factors are:
- Destruction of capital;
- Lack of savings, and;
- Time.
While lost capital gain be regained, the time lost “getting back to even,” cannot be. Unfortunately, we don’t live forever, and time is our ultimate enemy. This is also, after two major bear markets, the majority of “boomers” are simply unprepared financially for retirement.
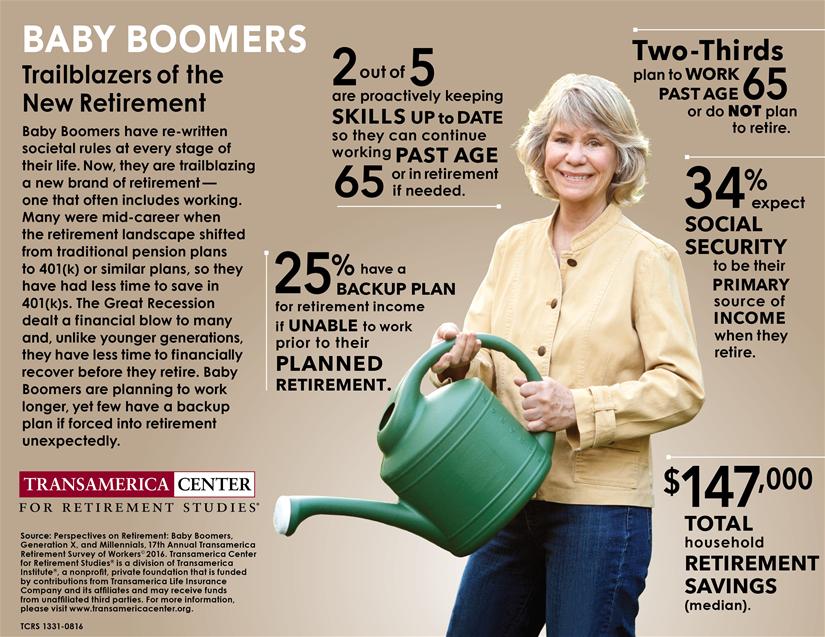
It is also the reason why we are facing a massive “pension crisis”in the not so distant future as capital destruction, low contribution rates, and over-estimation of returns has led to massive shortfalls to meet required distributions in the future.
Who wouldn’t love a world where everyone just invests some money, the markets rise 6% annually, and everyone one’s a winner?
Unfortunately, there is a vast difference between an “index”, which benefits from share buybacks, substitutions, and market capitalization weighting versus a portfolio invested in actual dollars. Yes, a “buy and hold” portfolio will grow in the financial markets over time, but it DOES NOT compound.
Read this carefully: “Compound returns assume no principal loss, ever.”
To visualize the importance of this statement, the chart below shows $100,000, adjusted for inflation, invested in 1990 versus a 6% annual compound rate of return. The shaded areas show whether the portfolio value exceeds the required rate of return to reach retirement goals. As noted, due to the impact of two bear markets, portfolios are well short of the targeted 6% annualized rate of return investors were told they would receive.
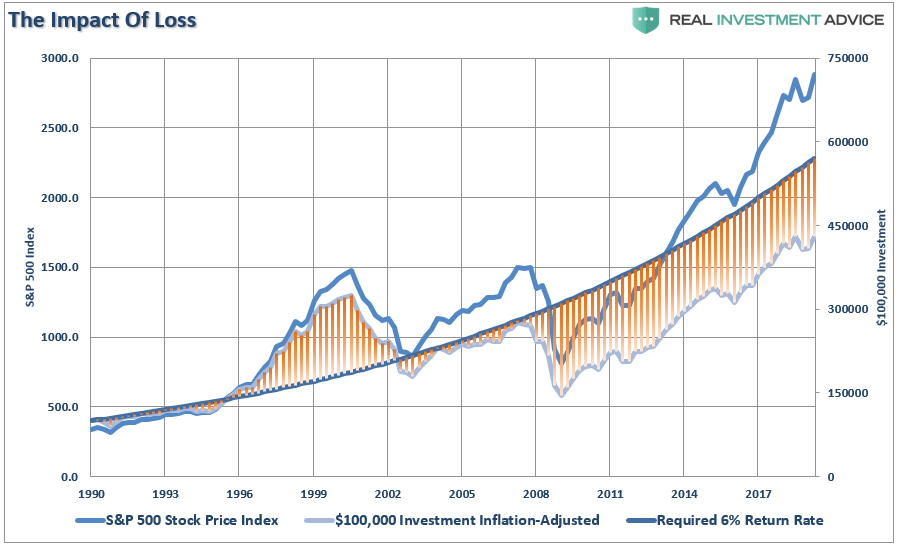
If your financial plan required 6% “compounded” annually to meet your retirement goals; you didn’t make it.
See the problem? People 30-years ago who were hoping to retire, simply can’t. It will likely be the case for individuals today looking to retire 30-years from now.
With markets now back to the second highest level of valuations on record, forward returns over the next 10-years are going to be substantially lower than they have been over the past 10-years.
That isn’t being bearish. That is just math.
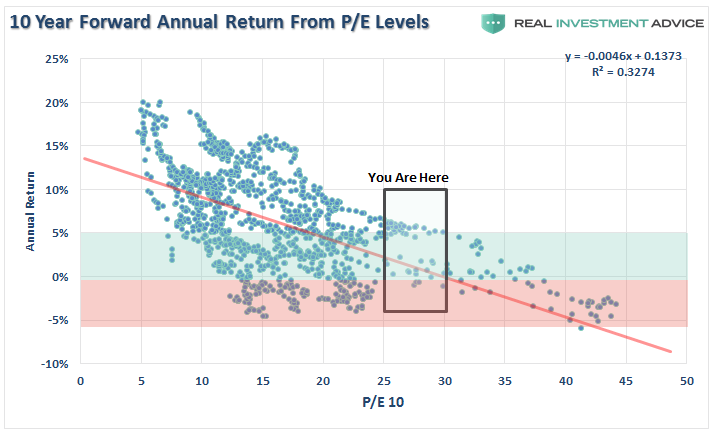
Dr. John Hussman previously wrote the most salient point on this topic.
Put simply, most apparent ‘opportunities’ to obtain investment returns above zero in conventional assets over the coming decade are based on a misunderstanding of valuations, total returns, and historical yield relationships. At current valuations, virtually everything is priced for a decade of zero.
Throughout history, bull market cycles are only one-half of the“full market” cycle. This is because during every “bull market” cycle the markets, and economy, build up excesses which are “reverted” during the following “bear market.”
As Sir Issac Newton once stated:
What goes up, must come down.
Looking beyond the very short-term overly optimistic view of “this time is different,” the coming unwinding of current speculative extremes will occur with the completion of the current market cycle.
When we look at 20-year trailing returns, there is sufficient historical evidence to suggest total, real returns, will decline towards zero over the next 3-years from 7% annualized currently. (These are trailing 20-year total real returns, not forward)
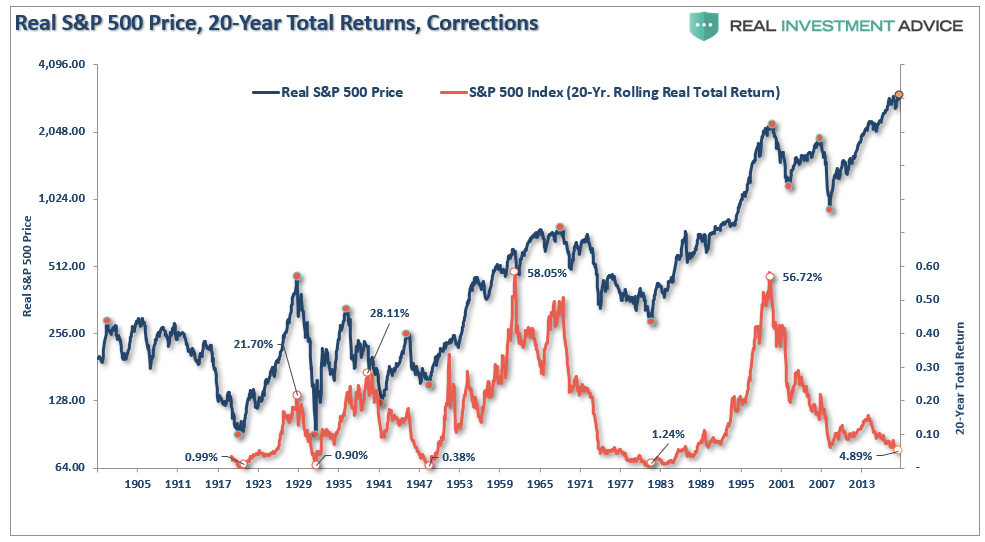
Re-read that last sentence again and look closely at the chart above. From current valuation levels, the annualized return on stocks by the end of the current 20-year cycle will be close to 0%. A decline in the next 3-years of only 30%, the average drawdown during a recession, will achieve that goal.
The second-half of this current cycle will begin likely sooner, rather than later. As stated, it is a function of time (length of market cycles), math (valuations) and physics (price deviations for long-term means.)
I am not bullish or bearish.
My job as a portfolio manager is simple; invest money in a manner that creates returns on a short-term basis while reducing the possibility of catastrophic losses over the long-term.
While “bulls have more fun” while markets are rising, both “bulls” and “bears” are owned by the “broken clock” syndrome during the completion of the full-market cycle.
The biggest secret in achieving long-term investment success is not necessarily being “right” during the first half of the cycle, but by not being “wrong” during the second half.
This is a lesson that CNBC should have learned by now.
